
Y2
Statistics
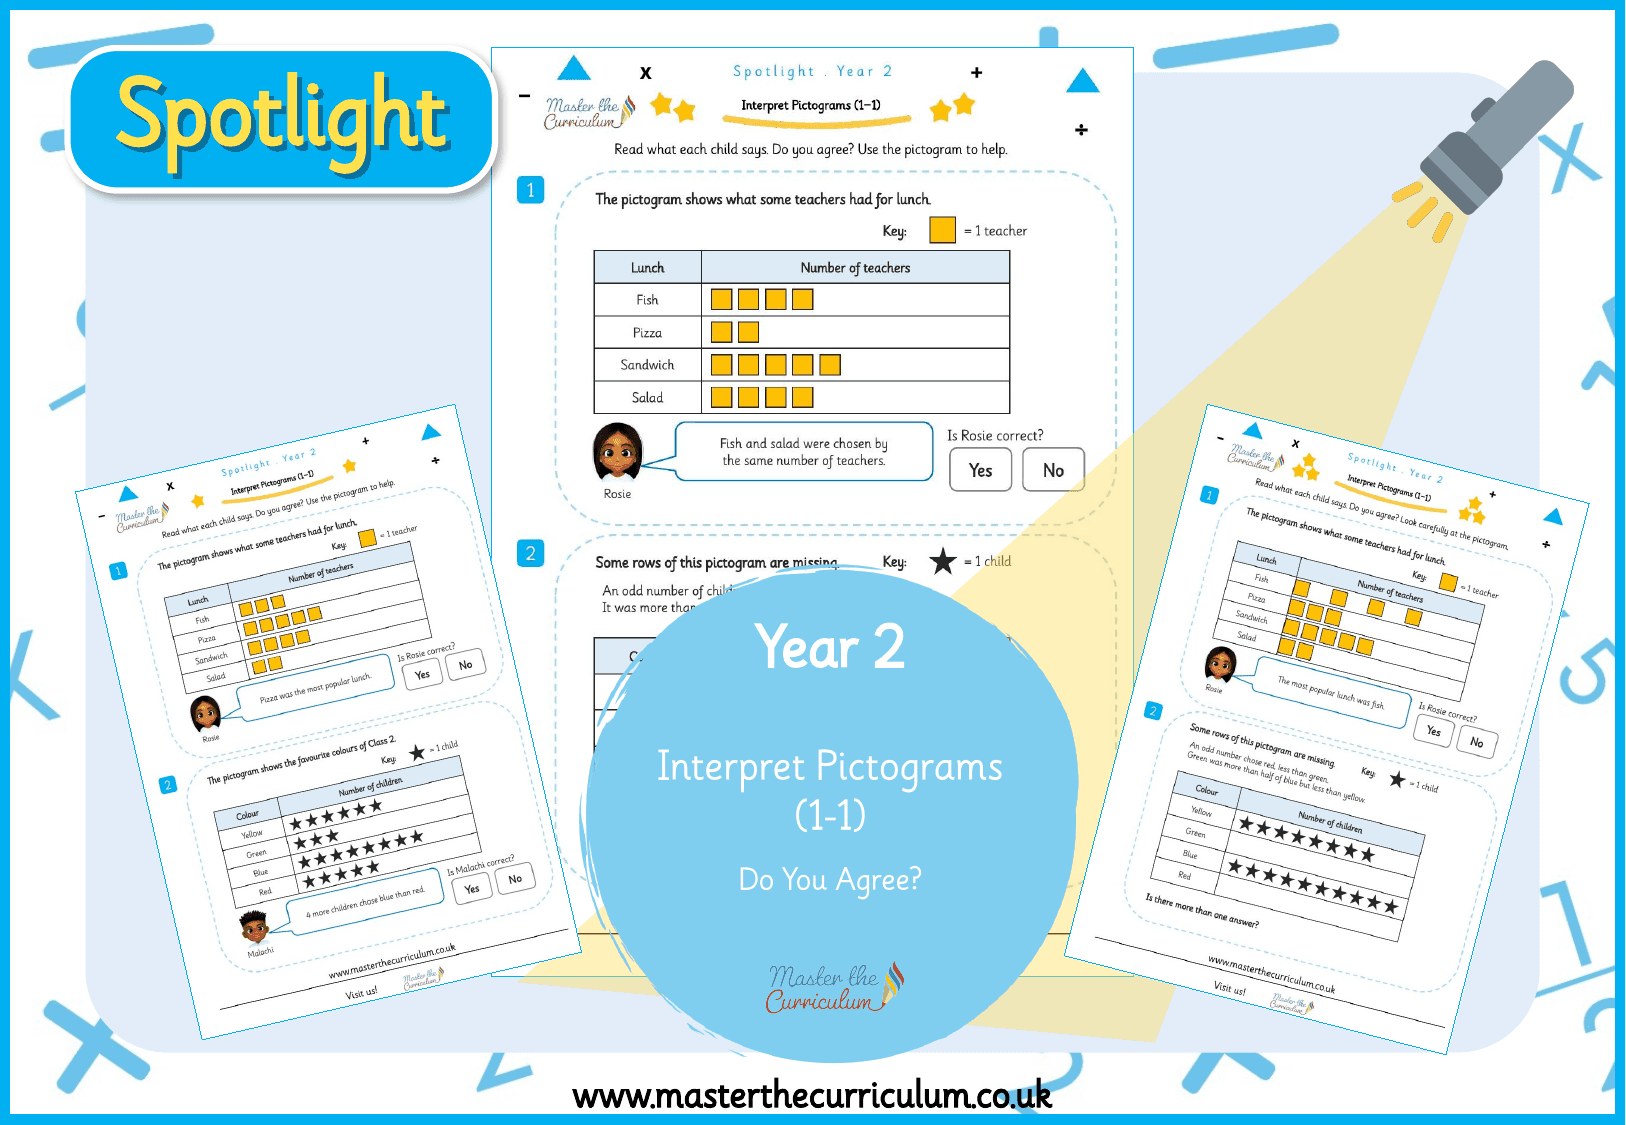
Spotlight Y2 Interpret Pictograms: Do You Agree?
masterthecurriculum.co.uk
3 levelsIncluded with membership
Trusted by primary teachers across the UK · New resources every week
2 previews
Preview only. The download is 3 files, listed in full below.
Every page is shown before you download. The files themselves come with membership, or sign in if you already have one.
Included with membership
Unlock with membershipAlready a member? Sign in and it downloads from this page.
Keep it for later and group it with the rest of the block. No account needed to start.
Year 2 – Editable Statistics Fluency & Reasoning Teaching Slides National Curriculum Objectives Covered: Interpret and construct simple pictograms, tally charts, block diagrams and simple tables. Ask and answer simple questions by counting the number of objects in each category and sorting the categories by quantity. Ask and answer questions about totalling and comparing categorical data.
This pack is listed as editable, so the editable copy comes with it. We do not print page counts here, because our catalogue does not publish them and a guessed number is worse than none.
Statistics
masterthecurriculum.co.uk
3 levels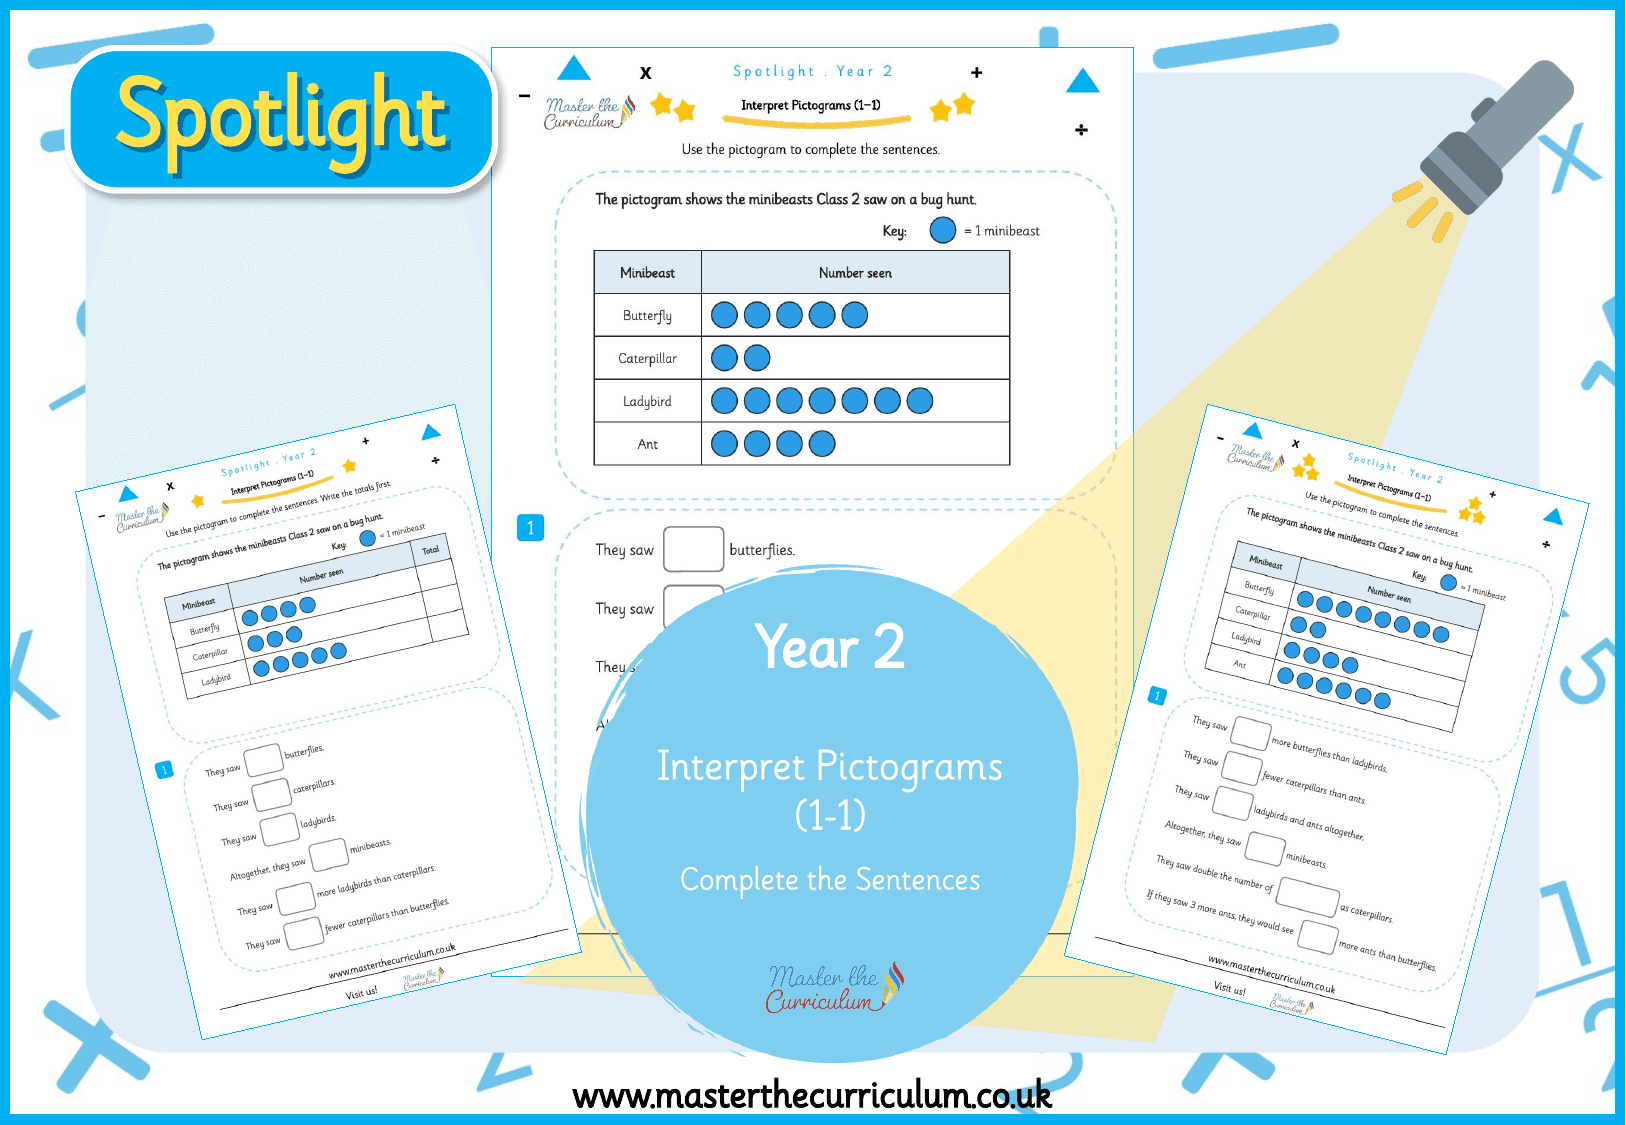
Statistics
masterthecurriculum.co.uk
3 levels
Statistics
masterthecurriculum.co.uk
3 levels
Statistics
masterthecurriculum.co.uk
3 levels
Statistics
masterthecurriculum.co.uk
3 levels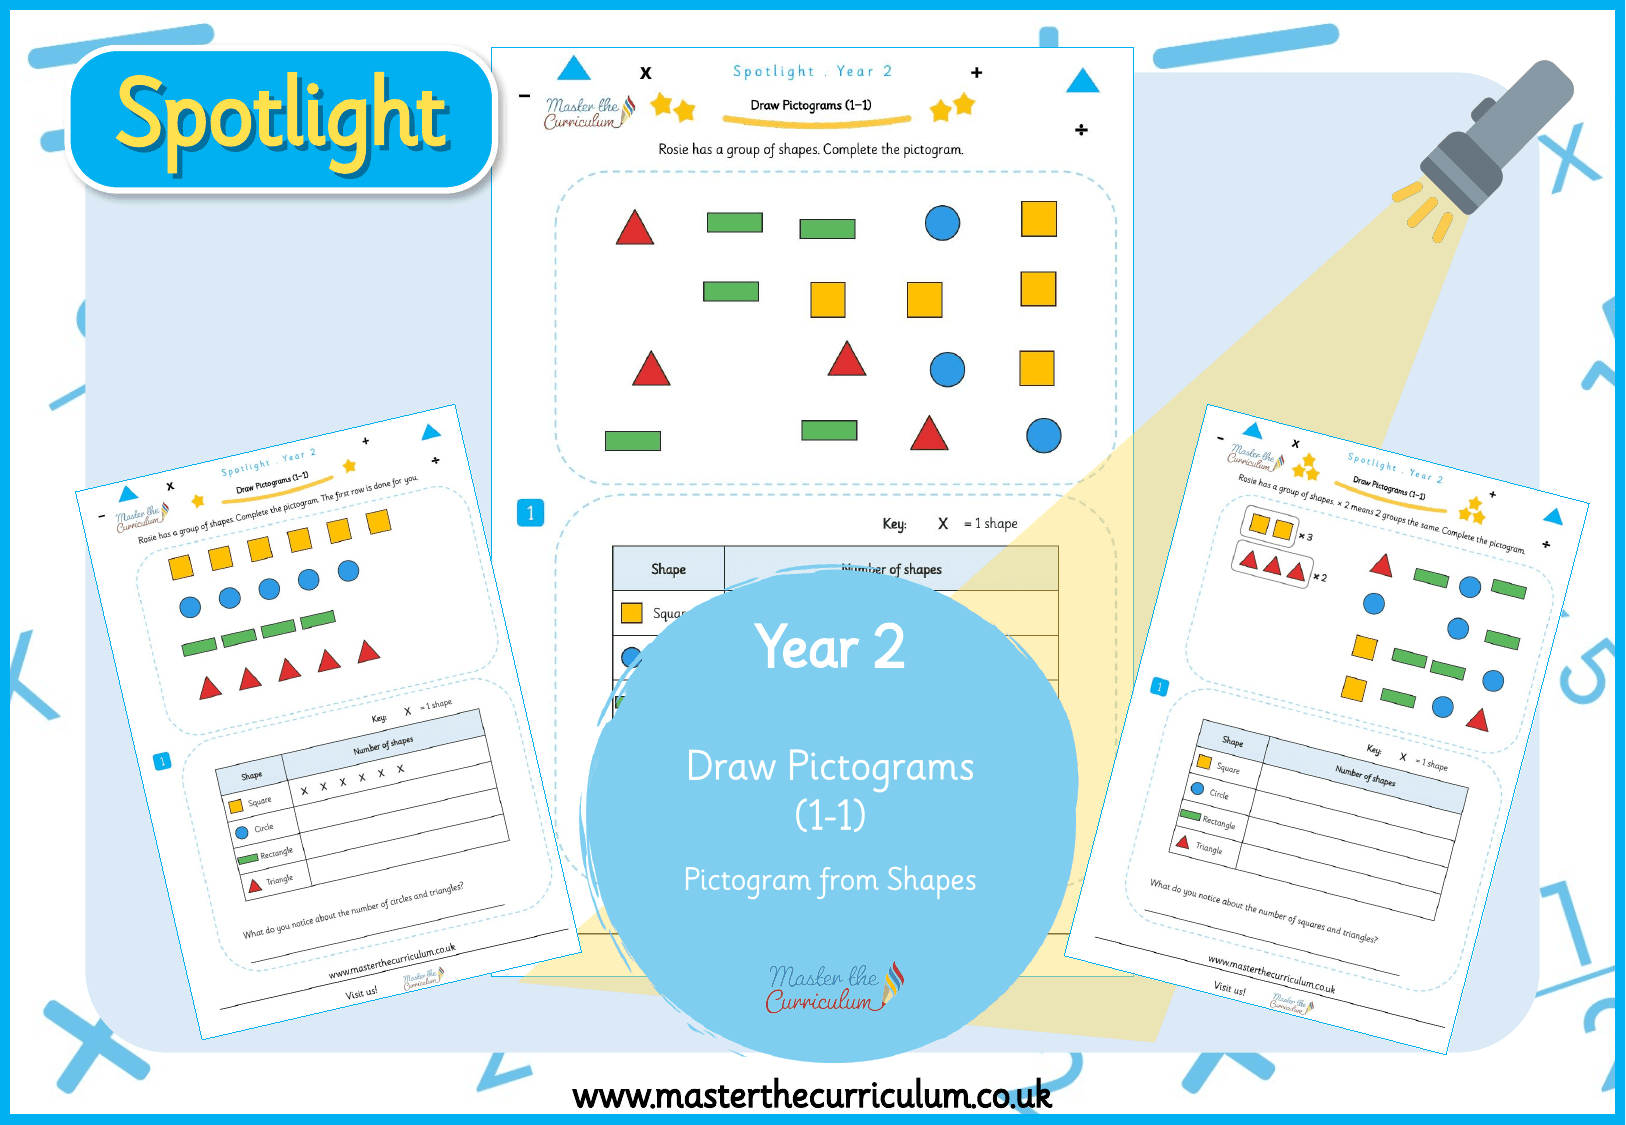
Geometry
masterthecurriculum.co.uk
3 levels
Statistics
masterthecurriculum.co.uk
3 levels
Statistics
masterthecurriculum.co.uk
3 levels