
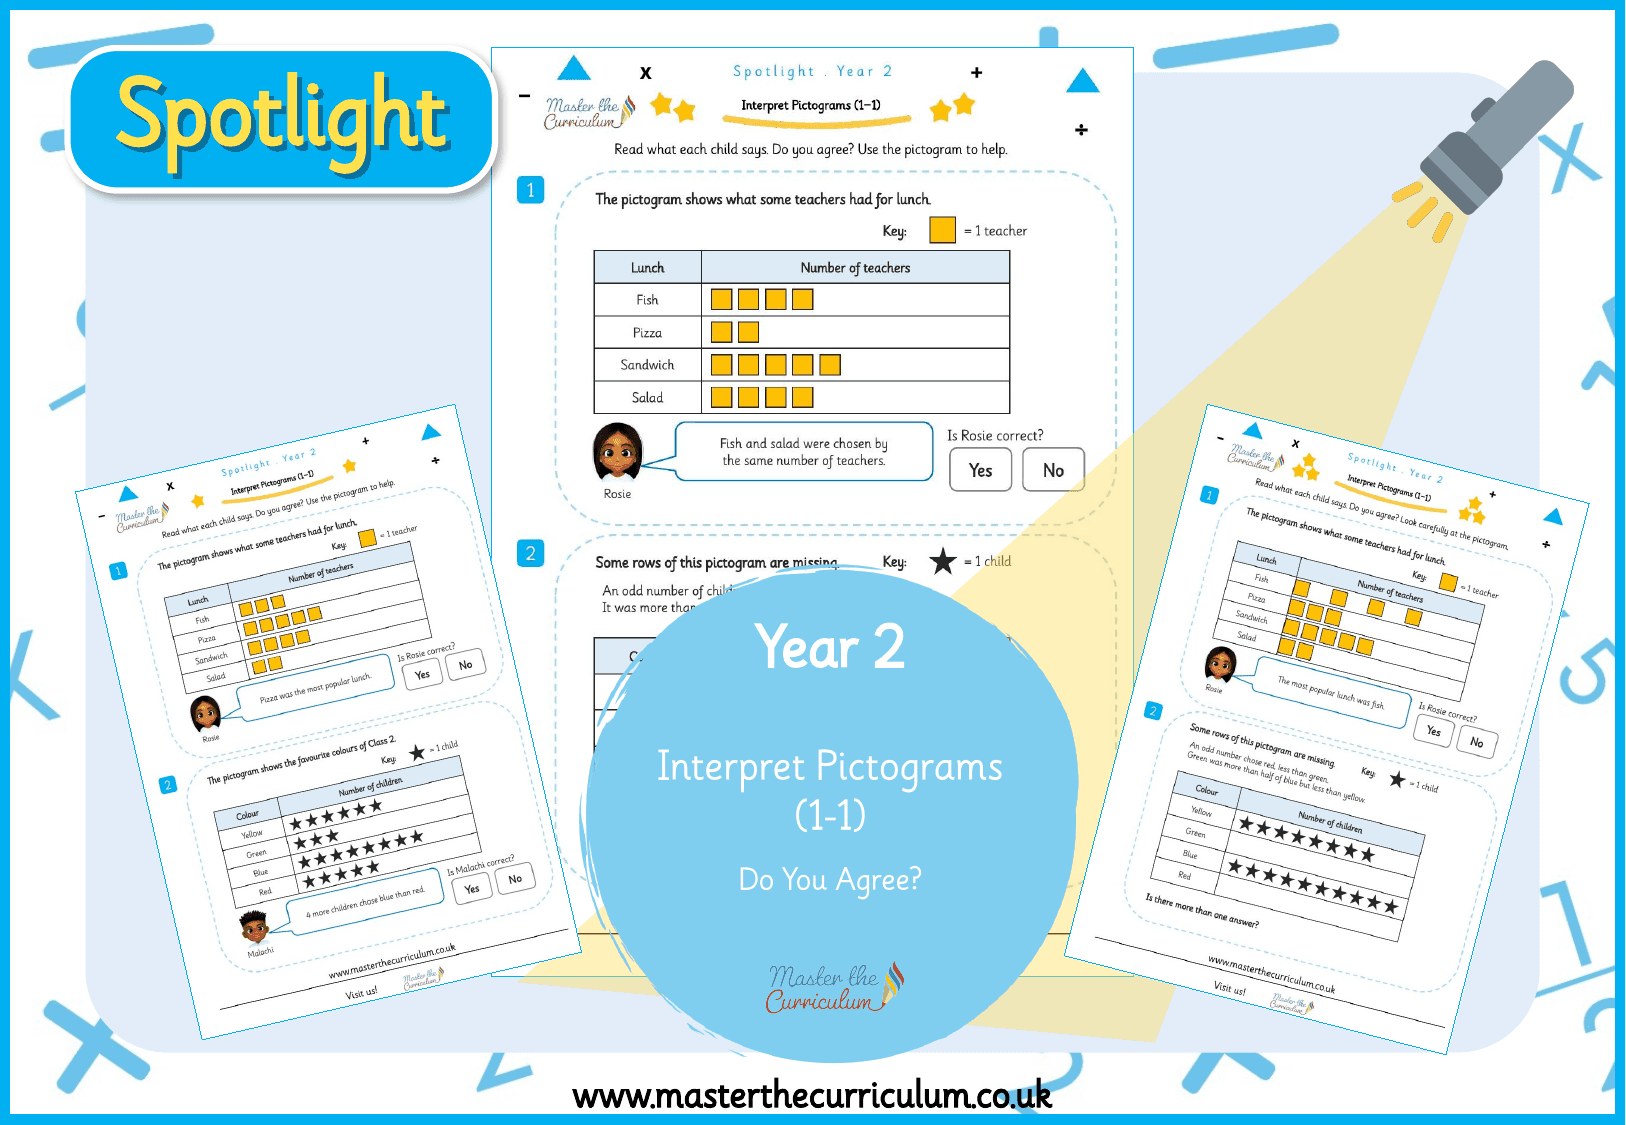
Y2
Statistics
Spotlight Y2 Interpret Pictograms: Do You Agree?
masterthecurriculum.co.uk
3 levelsIncluded with membership
Trusted by primary teachers across the UK · New resources every week
Preview only. The download is 4 files, listed in full below.
Every page is shown before you download. The files themselves come with membership, or sign in if you already have one.
Included with membership
Unlock with membershipAlready a member? Sign in and it downloads from this page.
Keep it for later and group it with the rest of the block. No account needed to start.
Year 2 – Spring – Week 1 – Editable Statistics Differentiated Sheets Week 1 L1 make tally charts – complete the tally chart L2- collect data in class L3 – draw pictograms L4 -draw pictograms- using a tally L5 interpret pictograms NEW 20/21 Lessons L1- Make tally charts activity L2- Make tally charts L3- Draw pictogram activity L4- Draw pictograms L5- Interpret Pictograms
This pack is listed as editable, so the editable copy comes with it. We do not print page counts here, because our catalogue does not publish them and a guessed number is worse than none.
Our own system, with the star count repeated in every worksheet header so a child can be handed the right sheet without a word.
Statistics
masterthecurriculum.co.uk
3 levels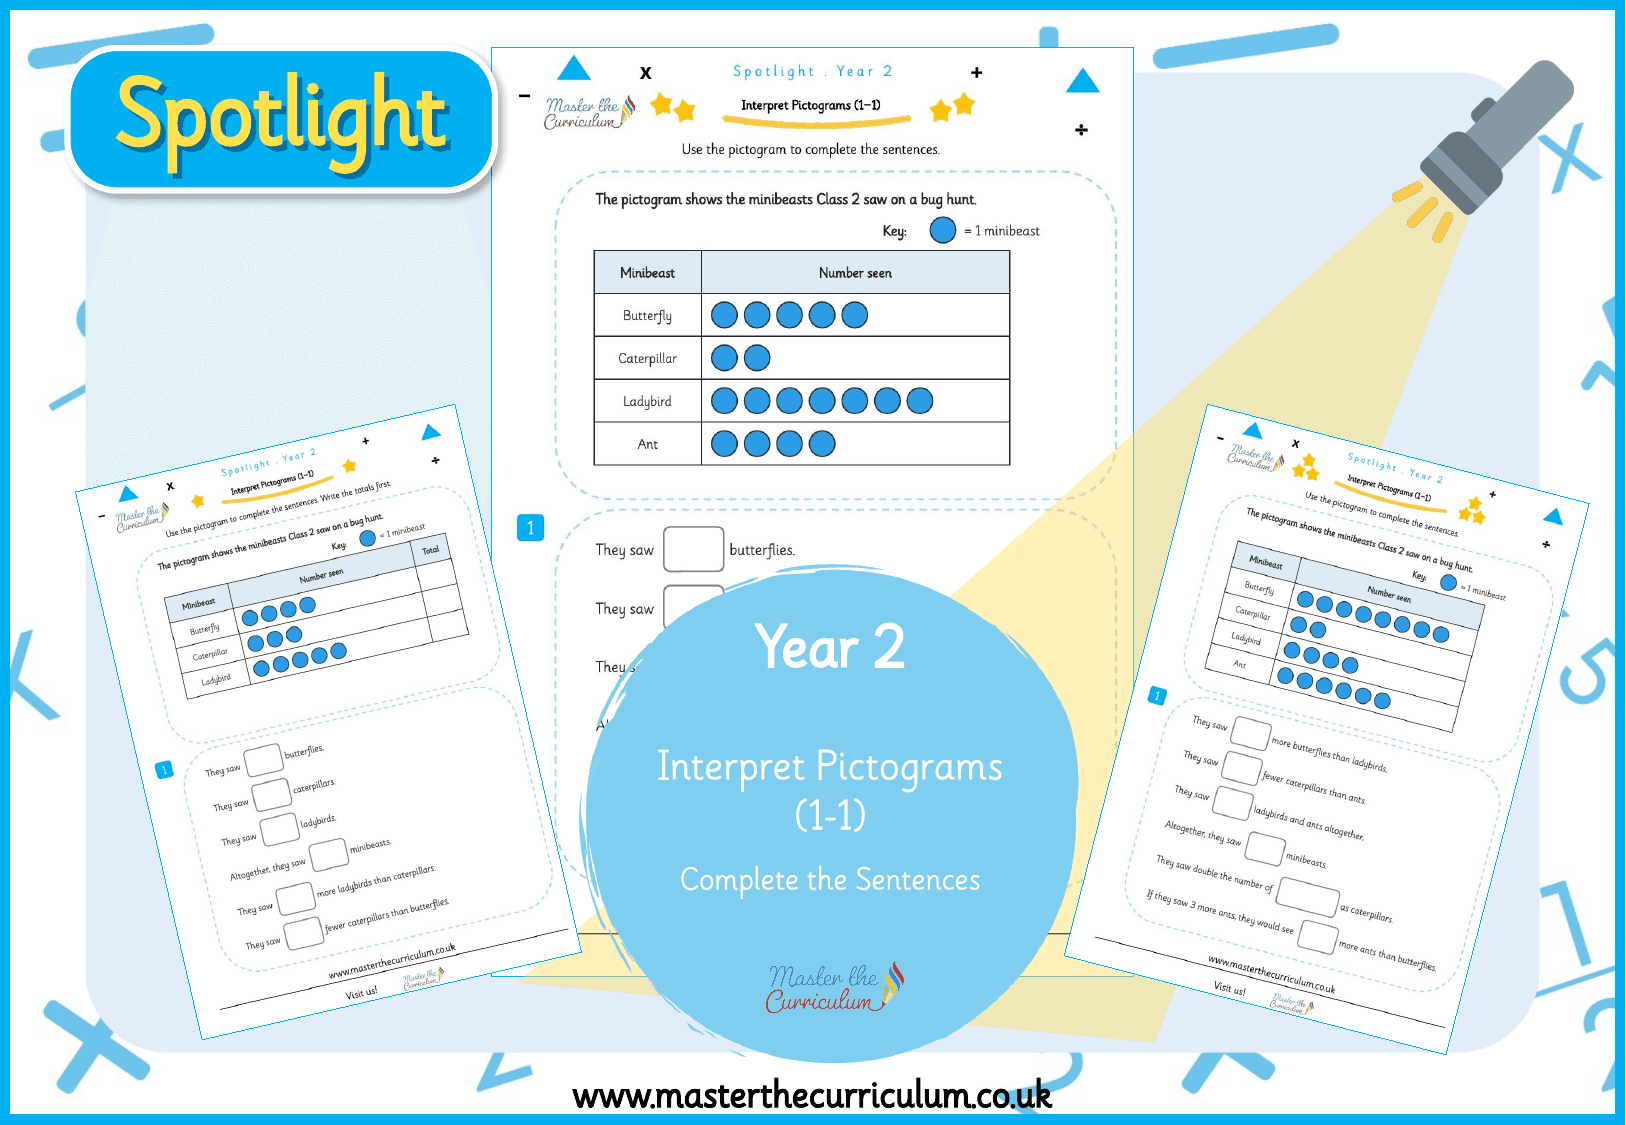
Statistics
masterthecurriculum.co.uk
3 levels
Statistics
masterthecurriculum.co.uk
3 levels
Statistics
masterthecurriculum.co.uk
3 levels
Statistics
masterthecurriculum.co.uk
3 levels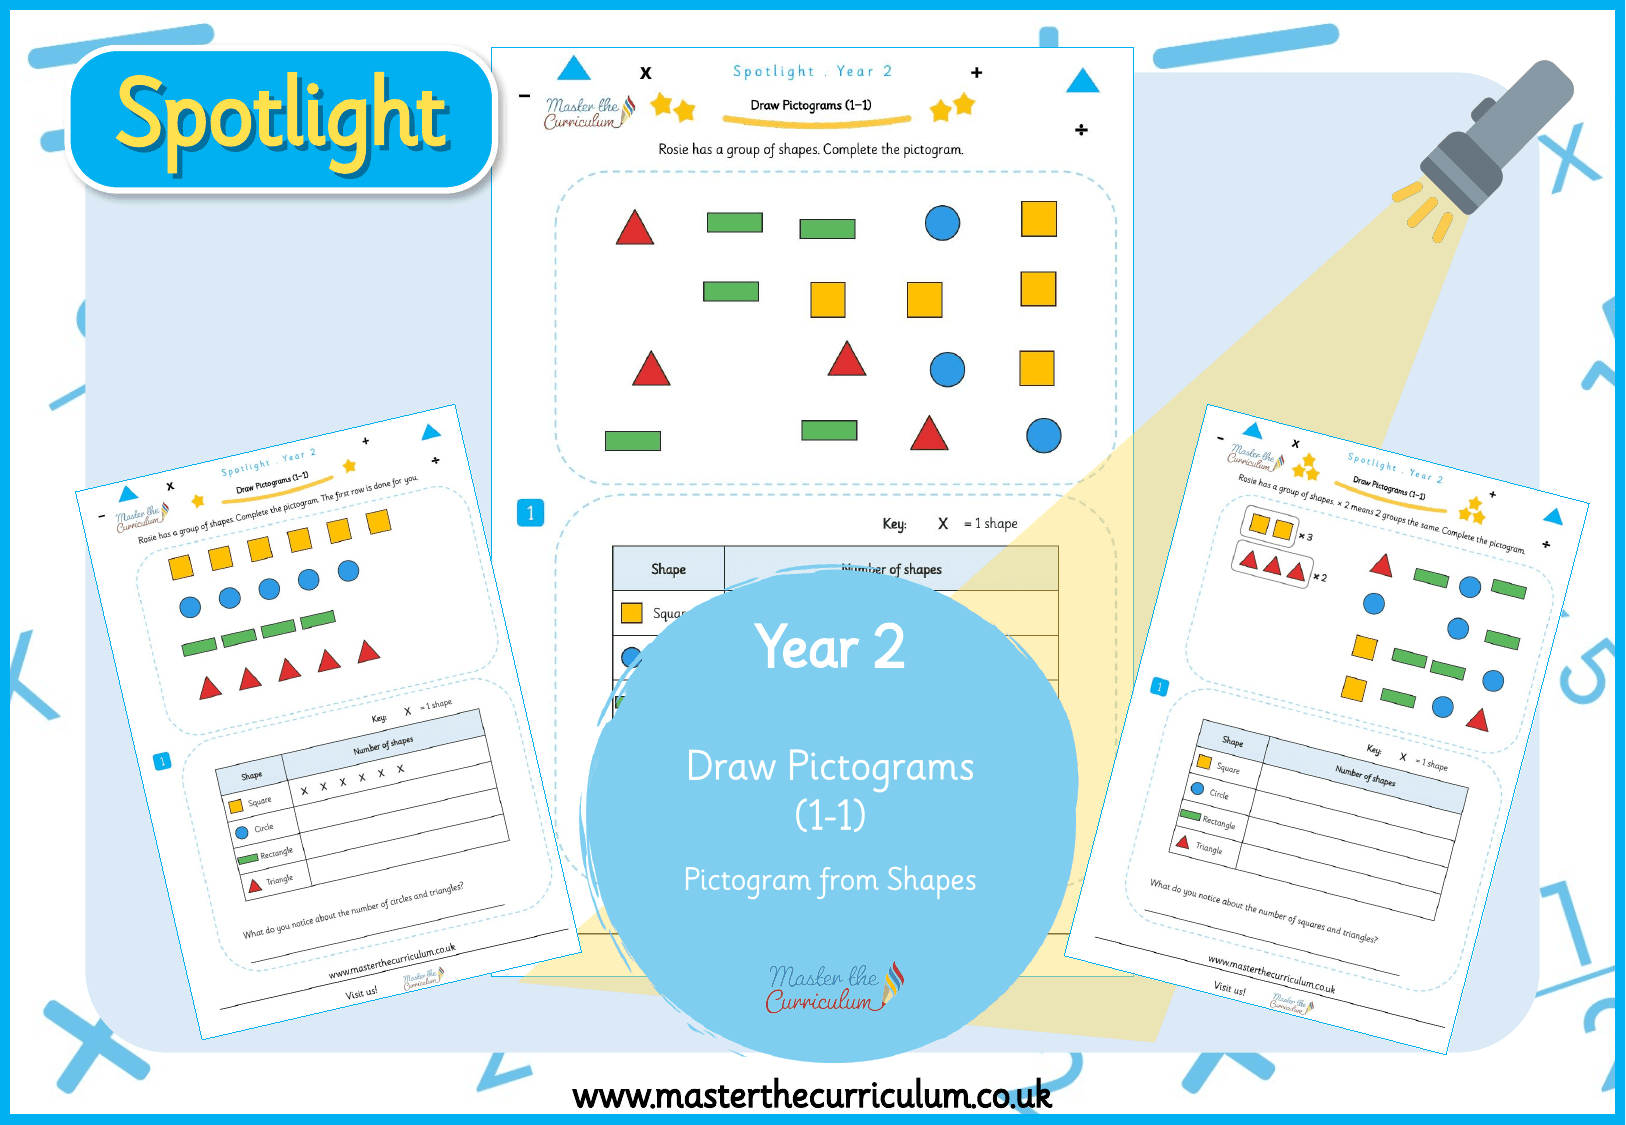
Geometry
masterthecurriculum.co.uk
3 levels
Statistics
masterthecurriculum.co.uk
3 levels
Statistics
masterthecurriculum.co.uk
3 levels