Skip to content

Y4

Statistics

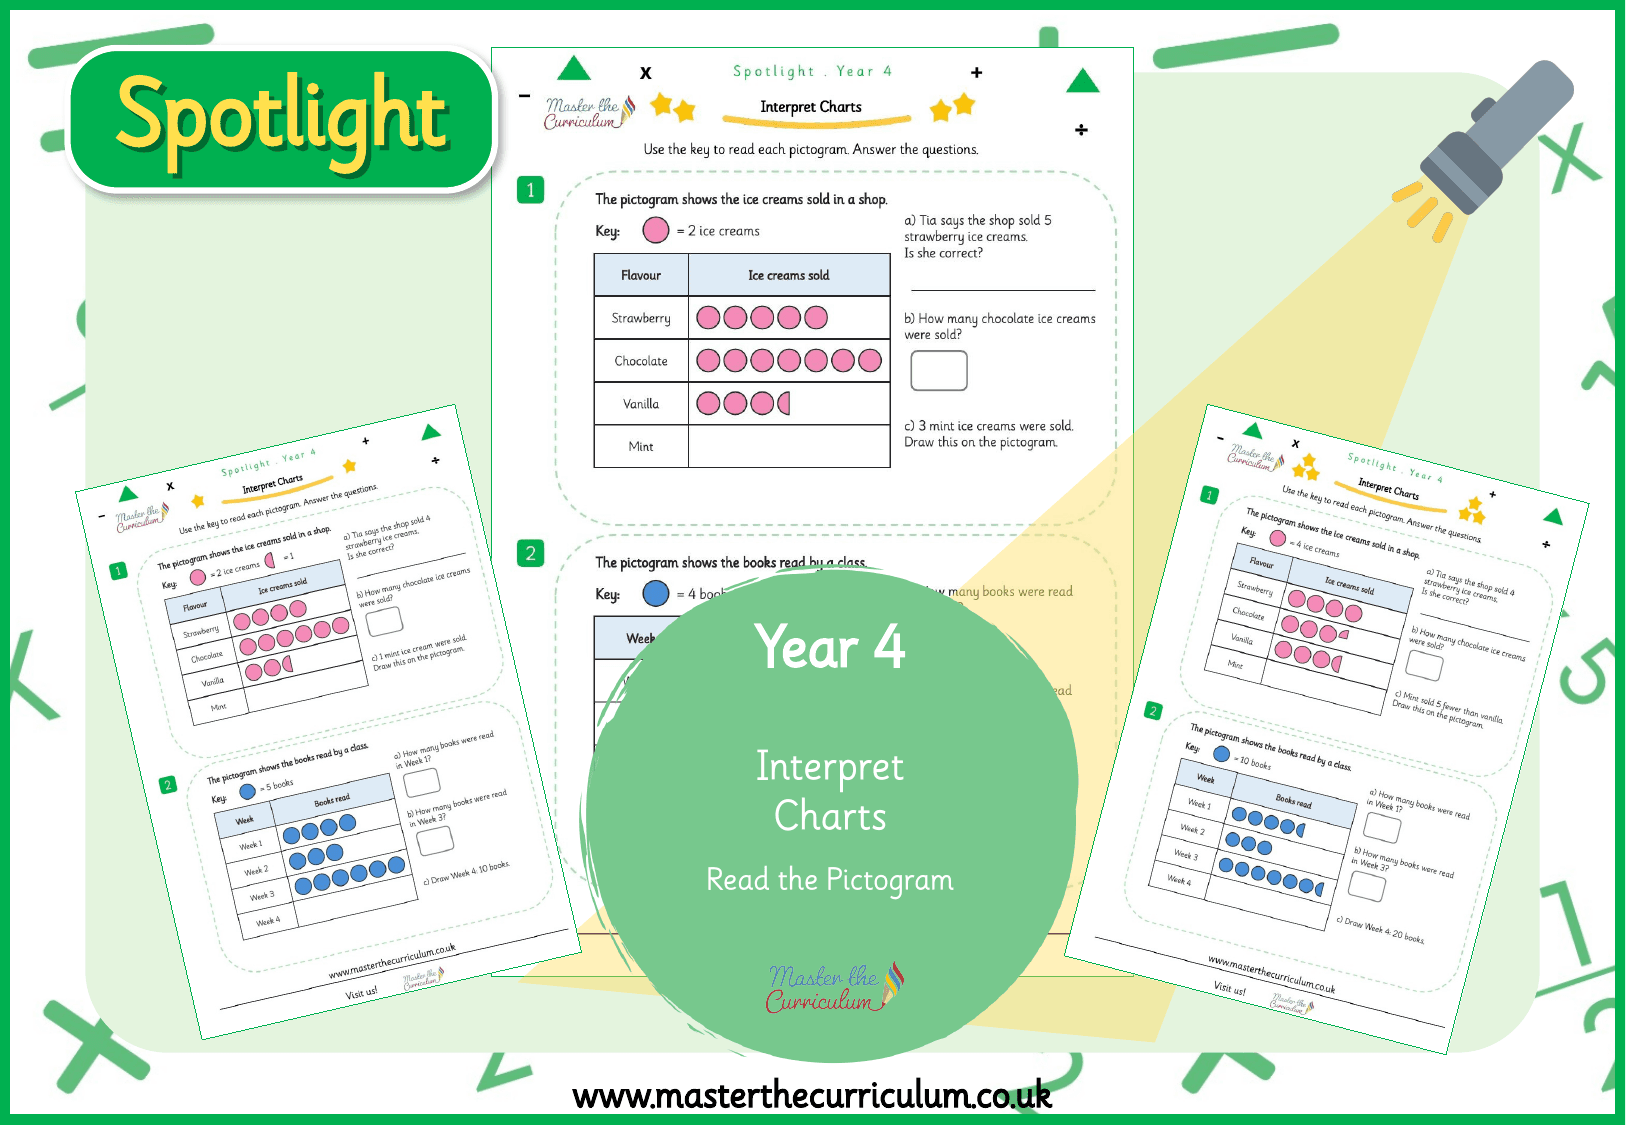
Spotlight Y4 Interpret Charts: Read the Pictogram

masterthecurriculum.co.uk

3 levels
Free, premium resource
Y4

Statistics

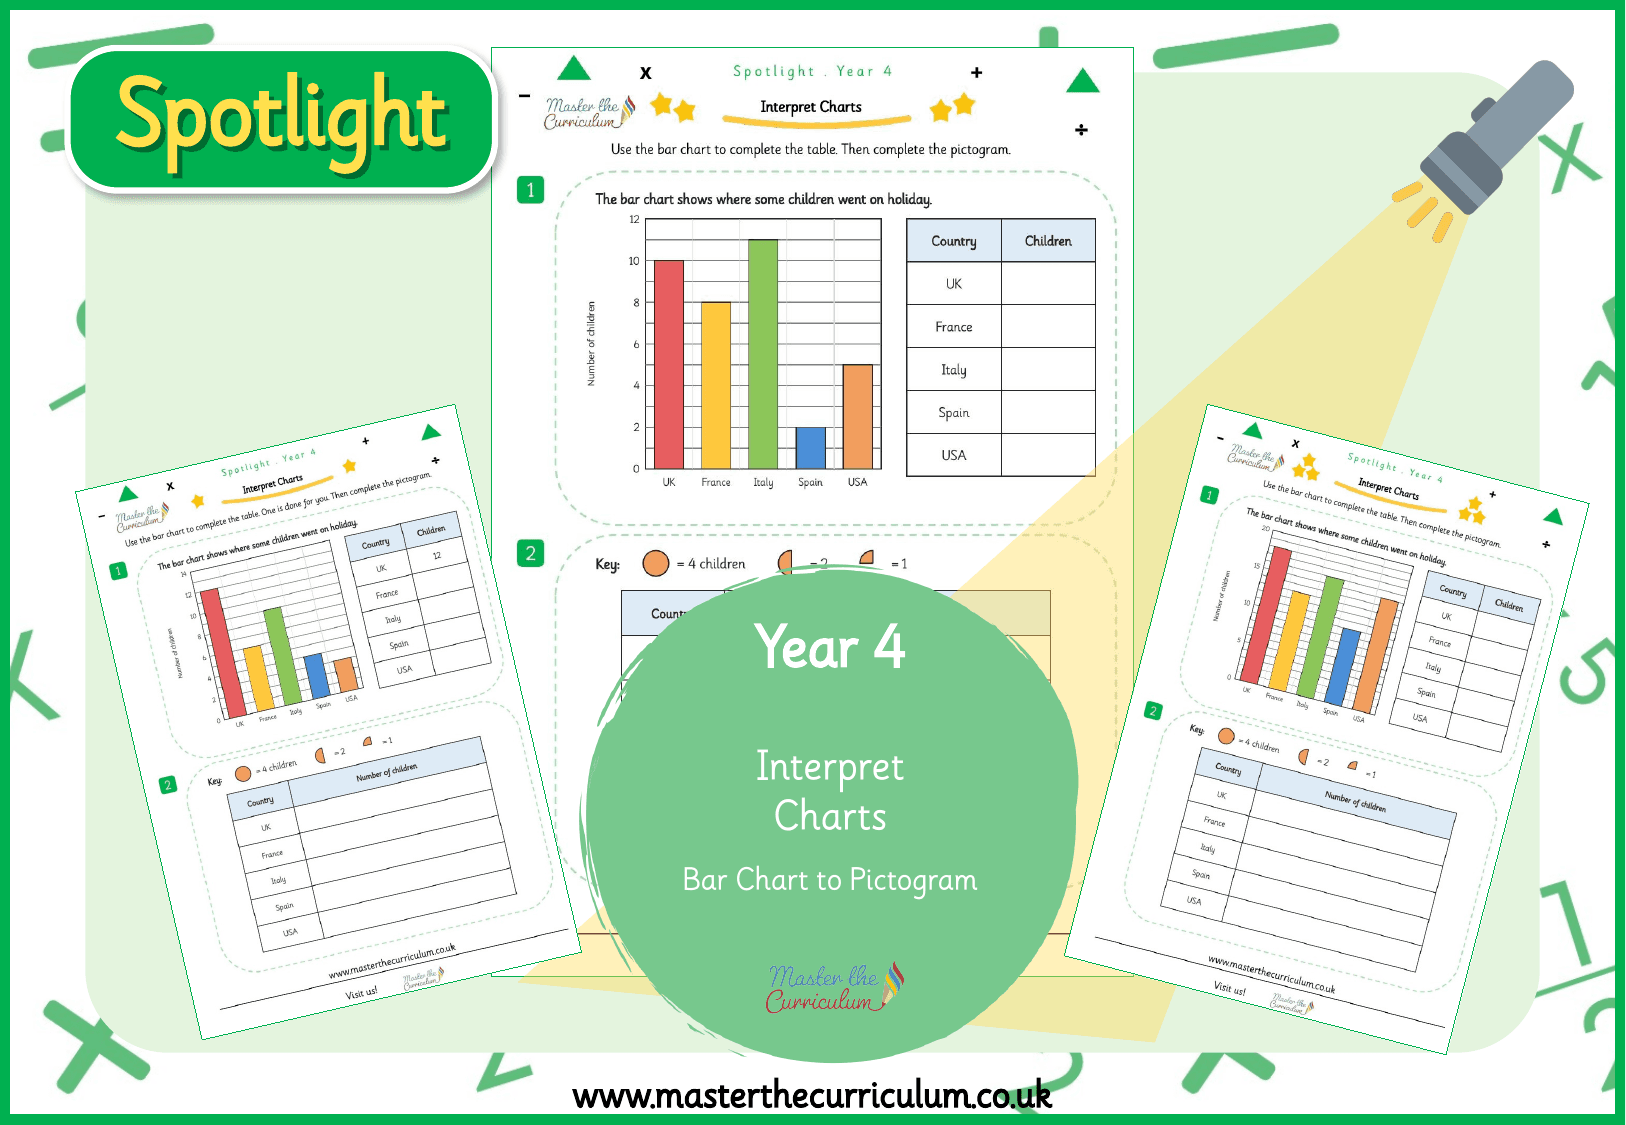
Spotlight Y4 Interpret Charts: Bar Chart to Pictogram

masterthecurriculum.co.uk

3 levels
Free, premium resource
Y4FREE

Statistics

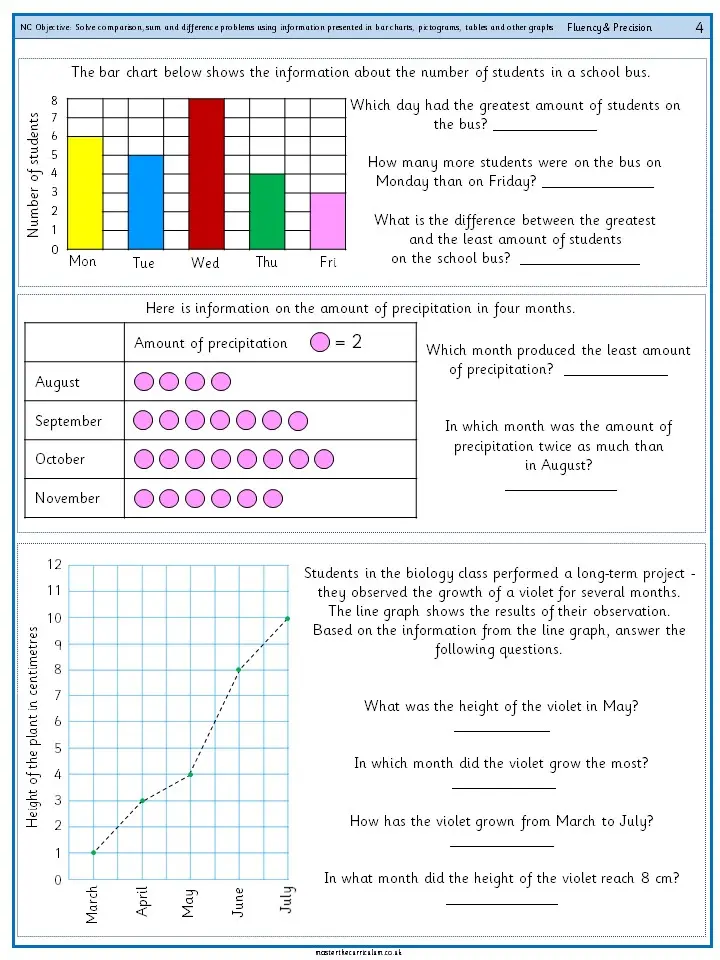
Solve comparison, sum and difference problems using information presented in bar charts, pictograms, tables and other graphs

masterthecurriculum.co.uk

Free download
Y4FREE

Measurement

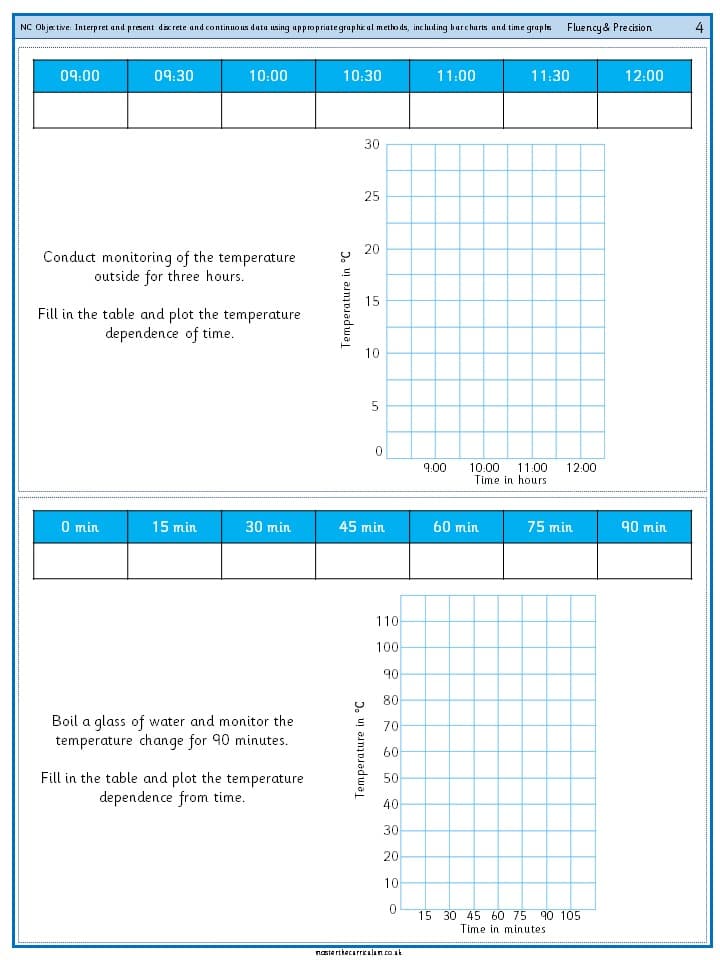
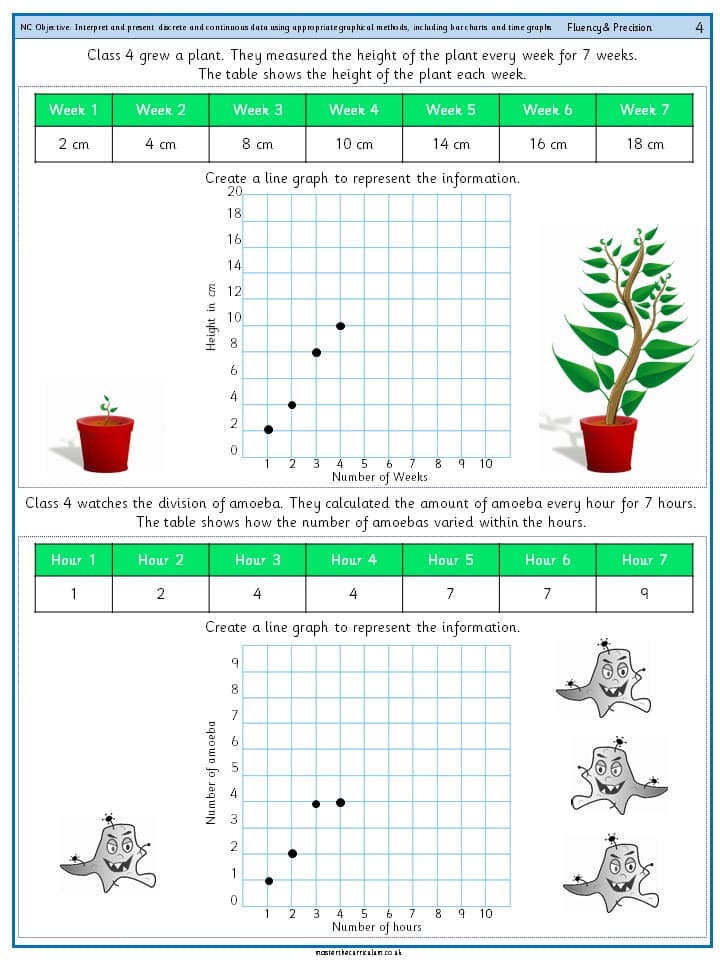
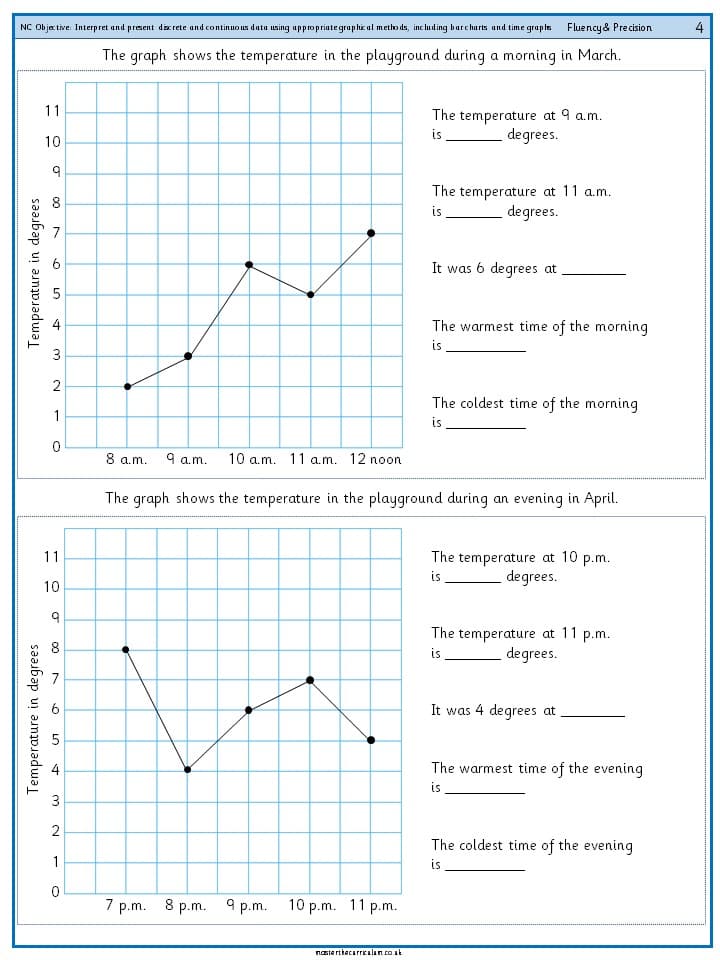
Interpret and present discrete and continuous data using appropriate graphical methods, including bar charts and time graphs – 4

masterthecurriculum.co.uk

Free download
Y4FREE

Measurement

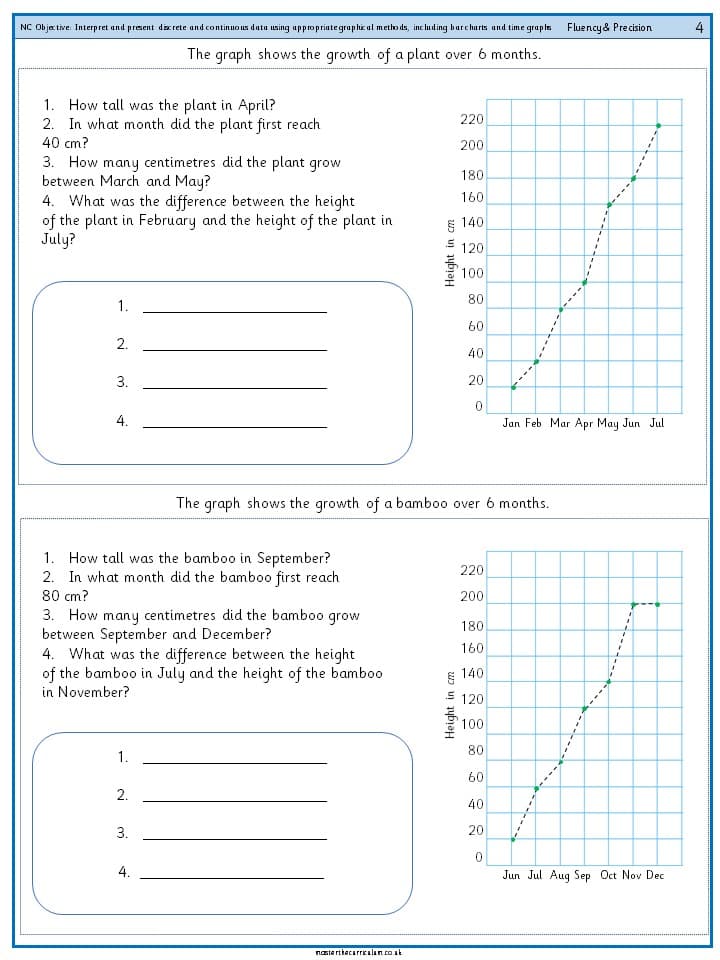
Interpret and present discrete and continuous data using appropriate graphical methods, including bar charts and time graphs – 3

masterthecurriculum.co.uk

Free download
Y4FREE

Measurement

Interpret and present discrete and continuous data using appropriate graphical methods, including bar charts and time graphs – 2

masterthecurriculum.co.uk

Free download
Y4FREE

Measurement

Interpret and present discrete and continuous data using appropriate graphical methods, including bar charts and time graphs – 1

masterthecurriculum.co.uk

Free download

Showing 1 to 8 of 8 free resources

Looking for more? Browse everything in Year 4

Editable resourcesOpens in PowerPoint so you can edit to suit your classWhite Rose supportingFollows the small steps you already plan fromKey eventsSeasonal and cultural resources for the moments in the school yearReasoning Maths HubReasoning and problem solving, by year group

Sign up to keep updated on new resources

An email when there is something new for the year group you actually teach. Unsubscribe in a click.

Year group you teach

We keep your address, and the year group you teach, so we can tell you when there is something new for it. Here is how we look after it: privacy policy.