Y4
Statistics
Spotlight Y4 Comparison, Sum and Difference: Two Ways to Total
masterthecurriculum.co.uk
3 levelsIncluded with membership
Trusted by primary teachers across the UK · New resources every week
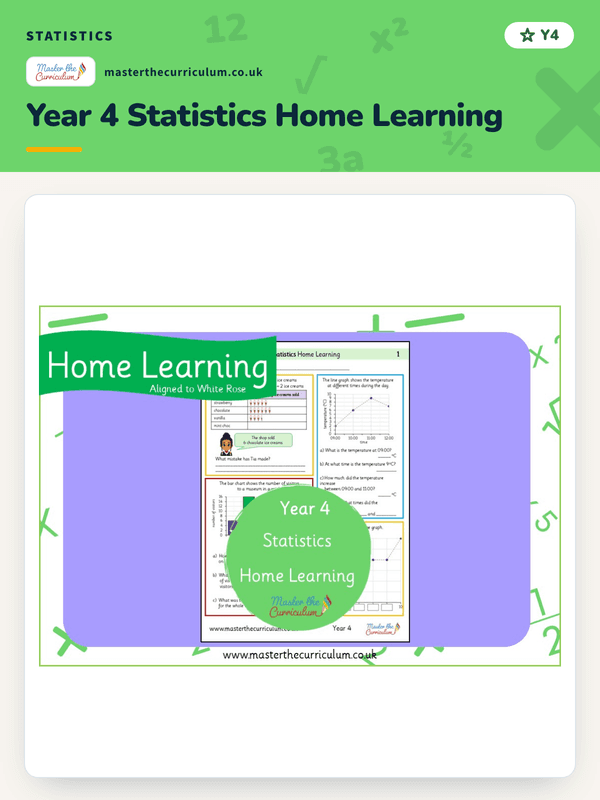
An engaging Year 4 Autumn Statistics worksheet designed to revise Year 3 data handling skills. Children interpret information from a pictogram and a bar chart to answer a range of questions. Ideal for revision, homework, early finishers, independent practice and autumn maths lessons.
Preview only. The download is one file, listed in full below.
Every page is shown before you download. The files themselves come with membership, or sign in if you already have one.
Included with membership
Unlock with membershipAlready a member? Sign in and it downloads from this page.
Keep it for later and group it with the rest of the block. No account needed to start.
Help your Year 4 pupils build confidence in interpreting data with this engaging Autumn Statistics worksheet. Perfect for consolidating prior learning, this maths activity revises key statistics objectives from the Year 3 Summer curriculum, making it ideal as a starter, early finisher task, independent practice, homework or revision activity. With a fun autumn theme, children interpret and answer questions using both a pictogram and a bar chart, developing essential data handling and reasoning skills. The varied questions encourage pupils to read scales carefully, compare data, calculate totals and differences, and explain their thinking. This low-prep resource is suitable for whole-class teaching, maths interventions, guided groups or independent learning. It also provides excellent evidence of understanding before introducing more challenging Year 4 statistics objectives. This resource includes: Autumn-themed statistics worksheet Questions based on a pictogram Questions based on a bar chart Opportunities to develop reasoning and problem-solving skills Ready-to-print PDF format Perfect for: Year 4 maths lessons Revising Year 3 statistics objectives Early finisher activities Morning work Homework Maths interventions Independent practice Seasonal autumn maths activities Curriculum focus: Interpret and present data using pictograms and bar charts Answer questions using information presented in charts Compare and interpret data Develop mathematical reasoning through data handling
This pack is print and go. Our catalogue does not list an editable copy of it, so none is offered here rather than promising a file nobody has opened. Page counts are not printed either, because we do not publish them and a guessed number is worse than none.
Statistics
masterthecurriculum.co.uk
3 levels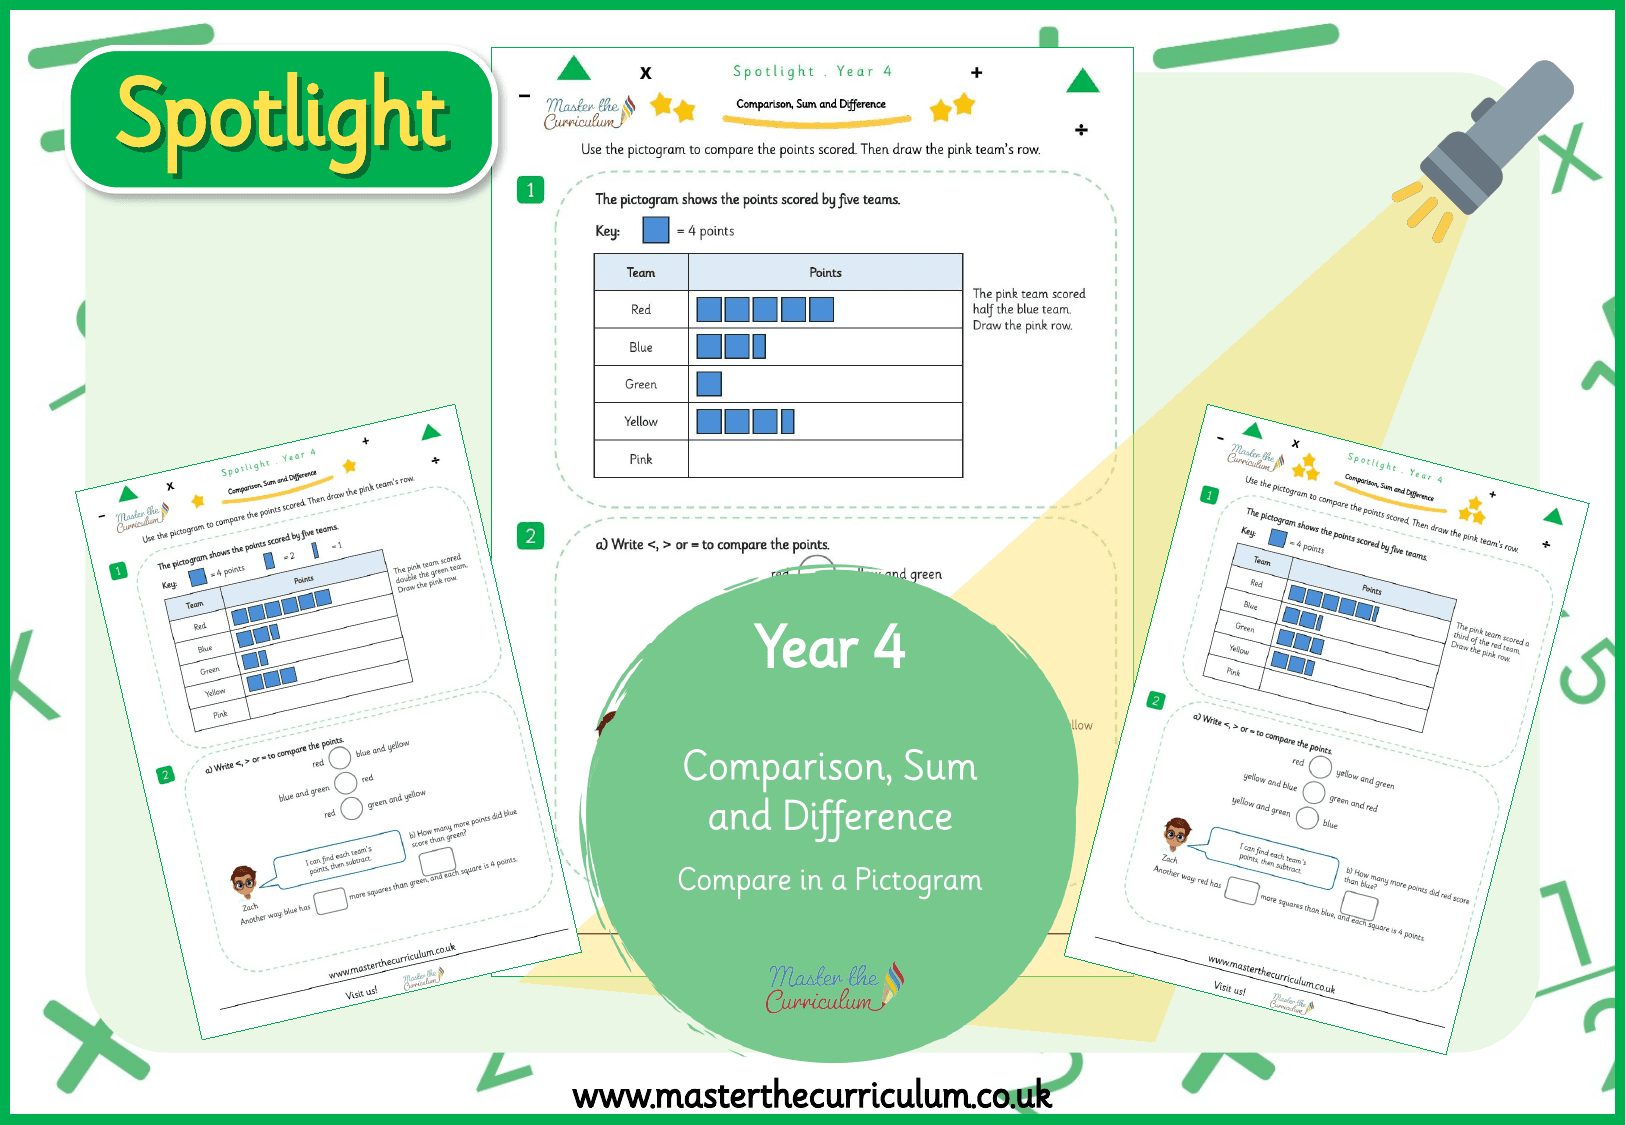
Statistics
masterthecurriculum.co.uk
3 levels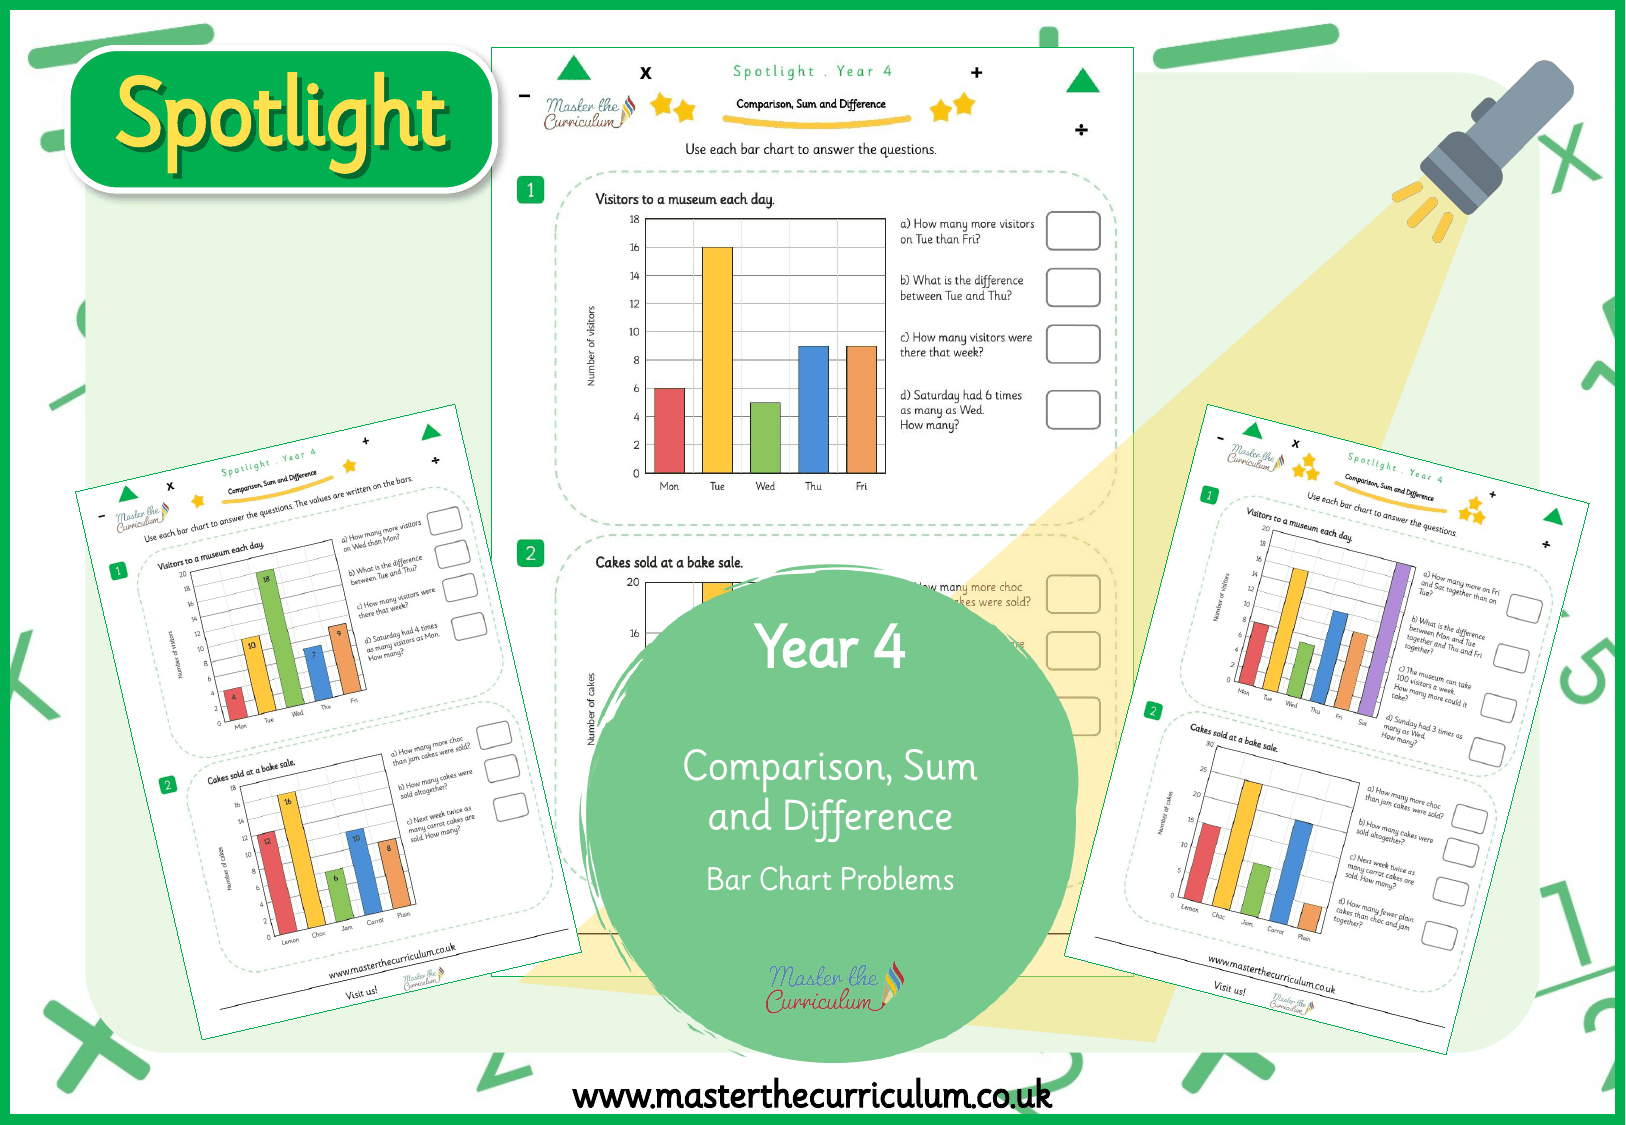
Statistics
masterthecurriculum.co.uk
3 levels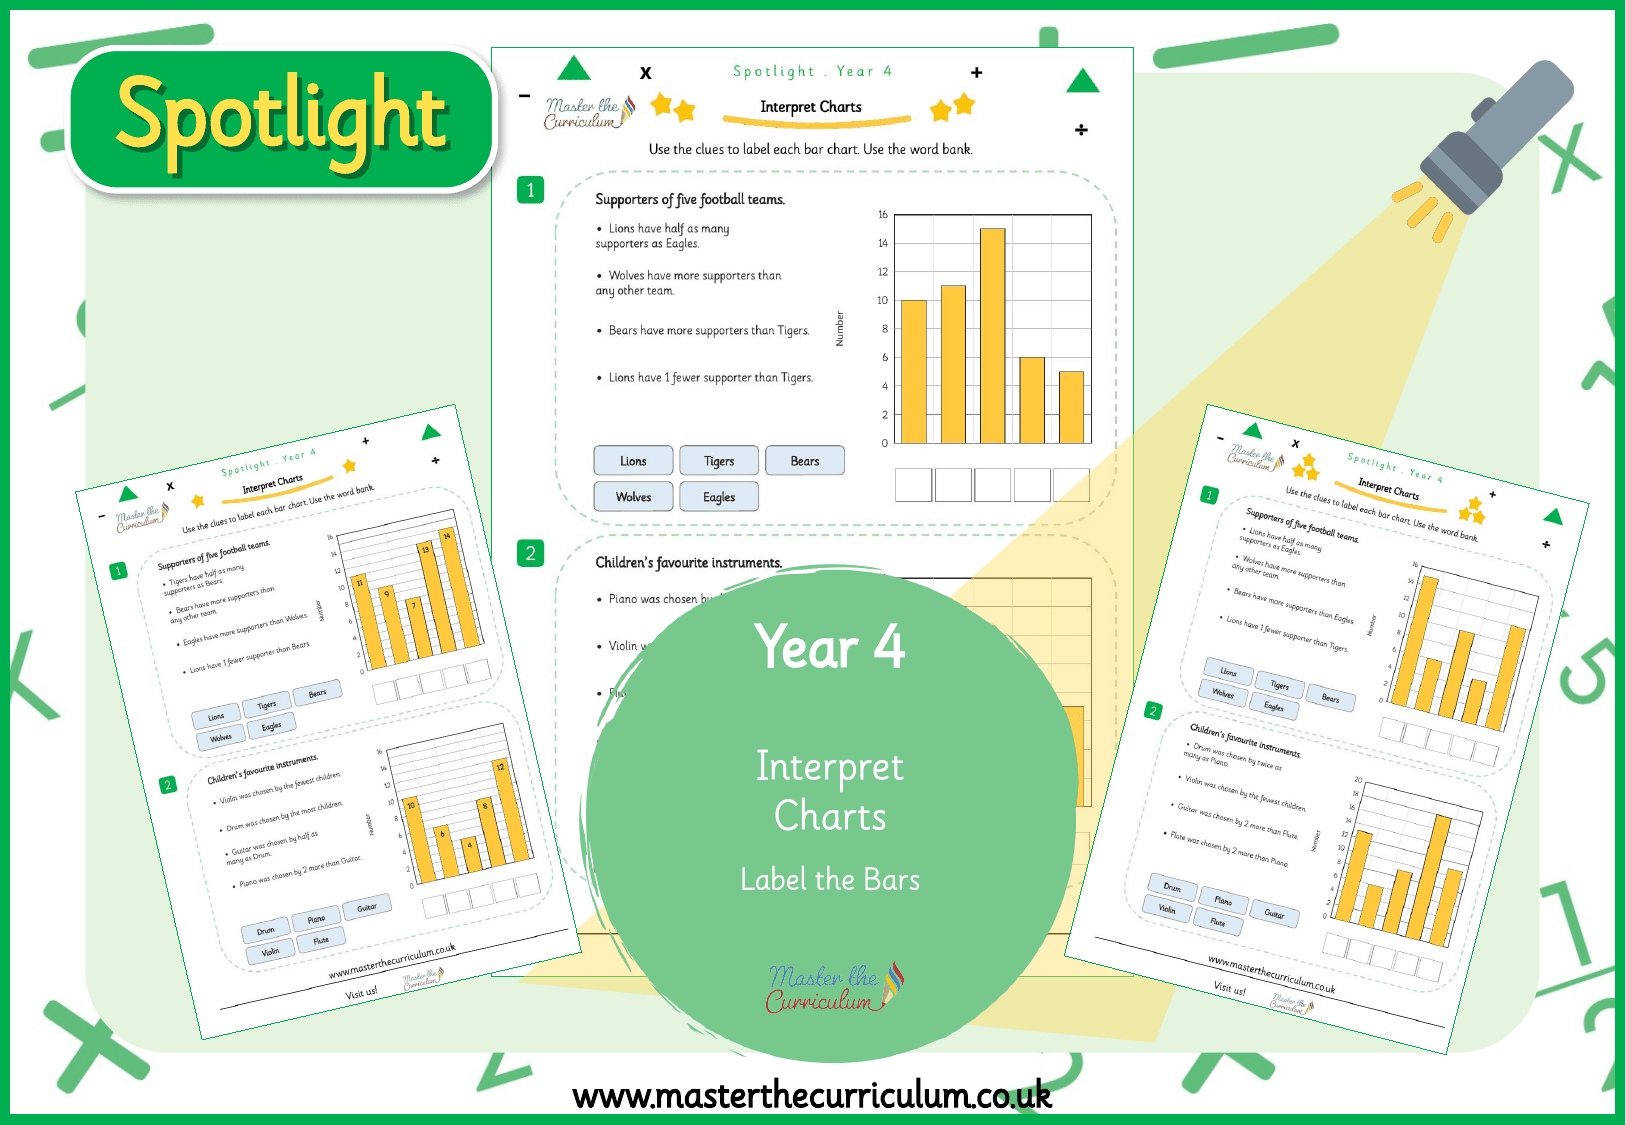
Statistics
masterthecurriculum.co.uk
3 levels
Statistics
masterthecurriculum.co.uk
3 levels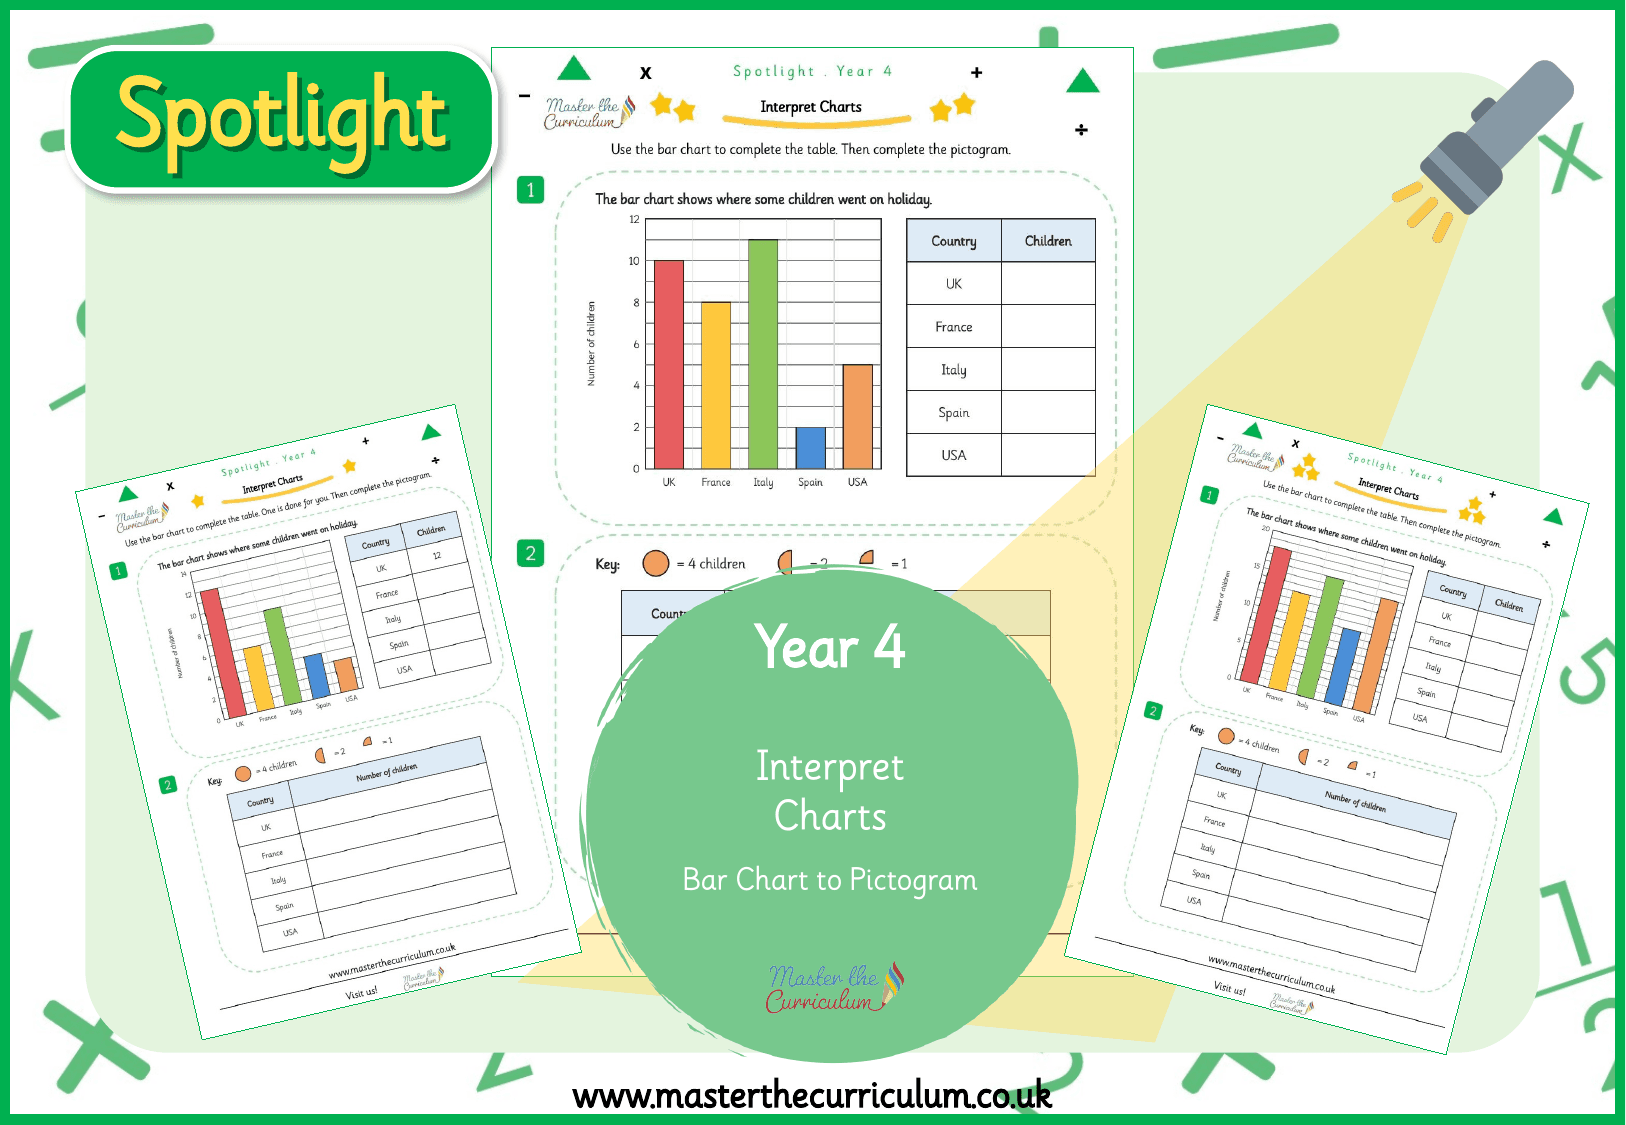
Statistics
masterthecurriculum.co.uk
3 levels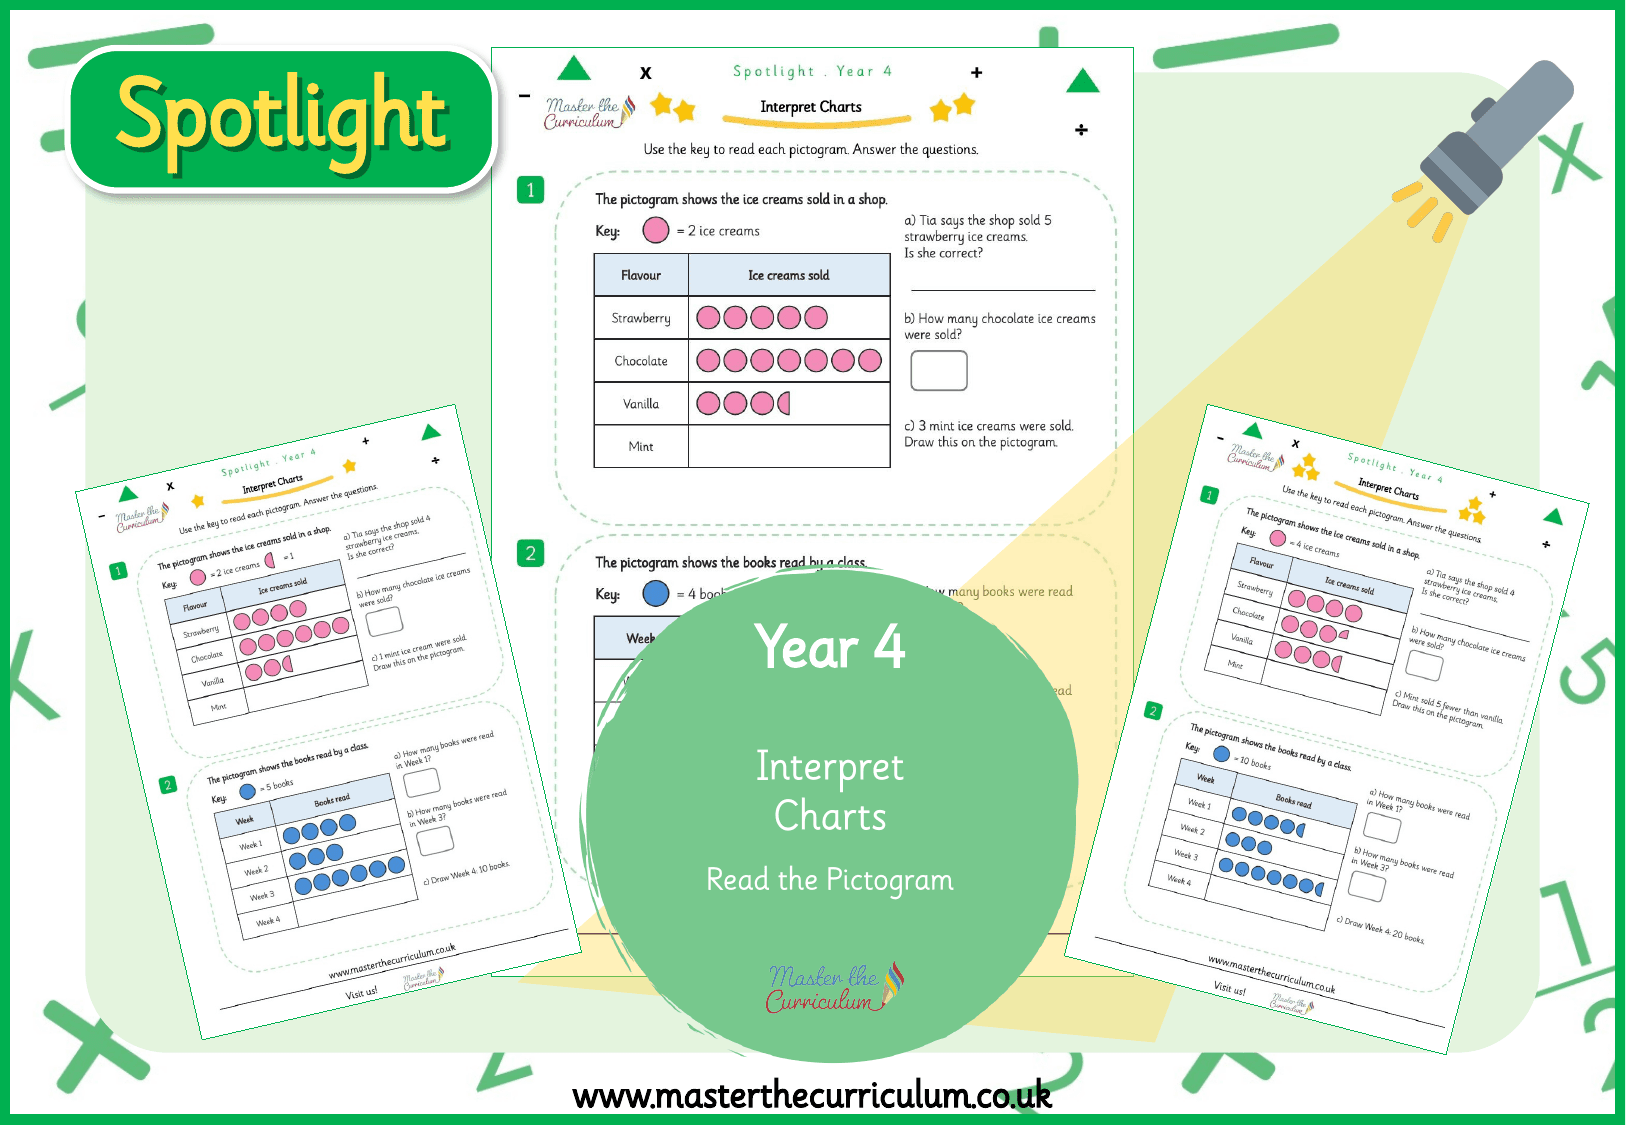
Statistics
masterthecurriculum.co.uk
3 levels