
Y5
Statistics
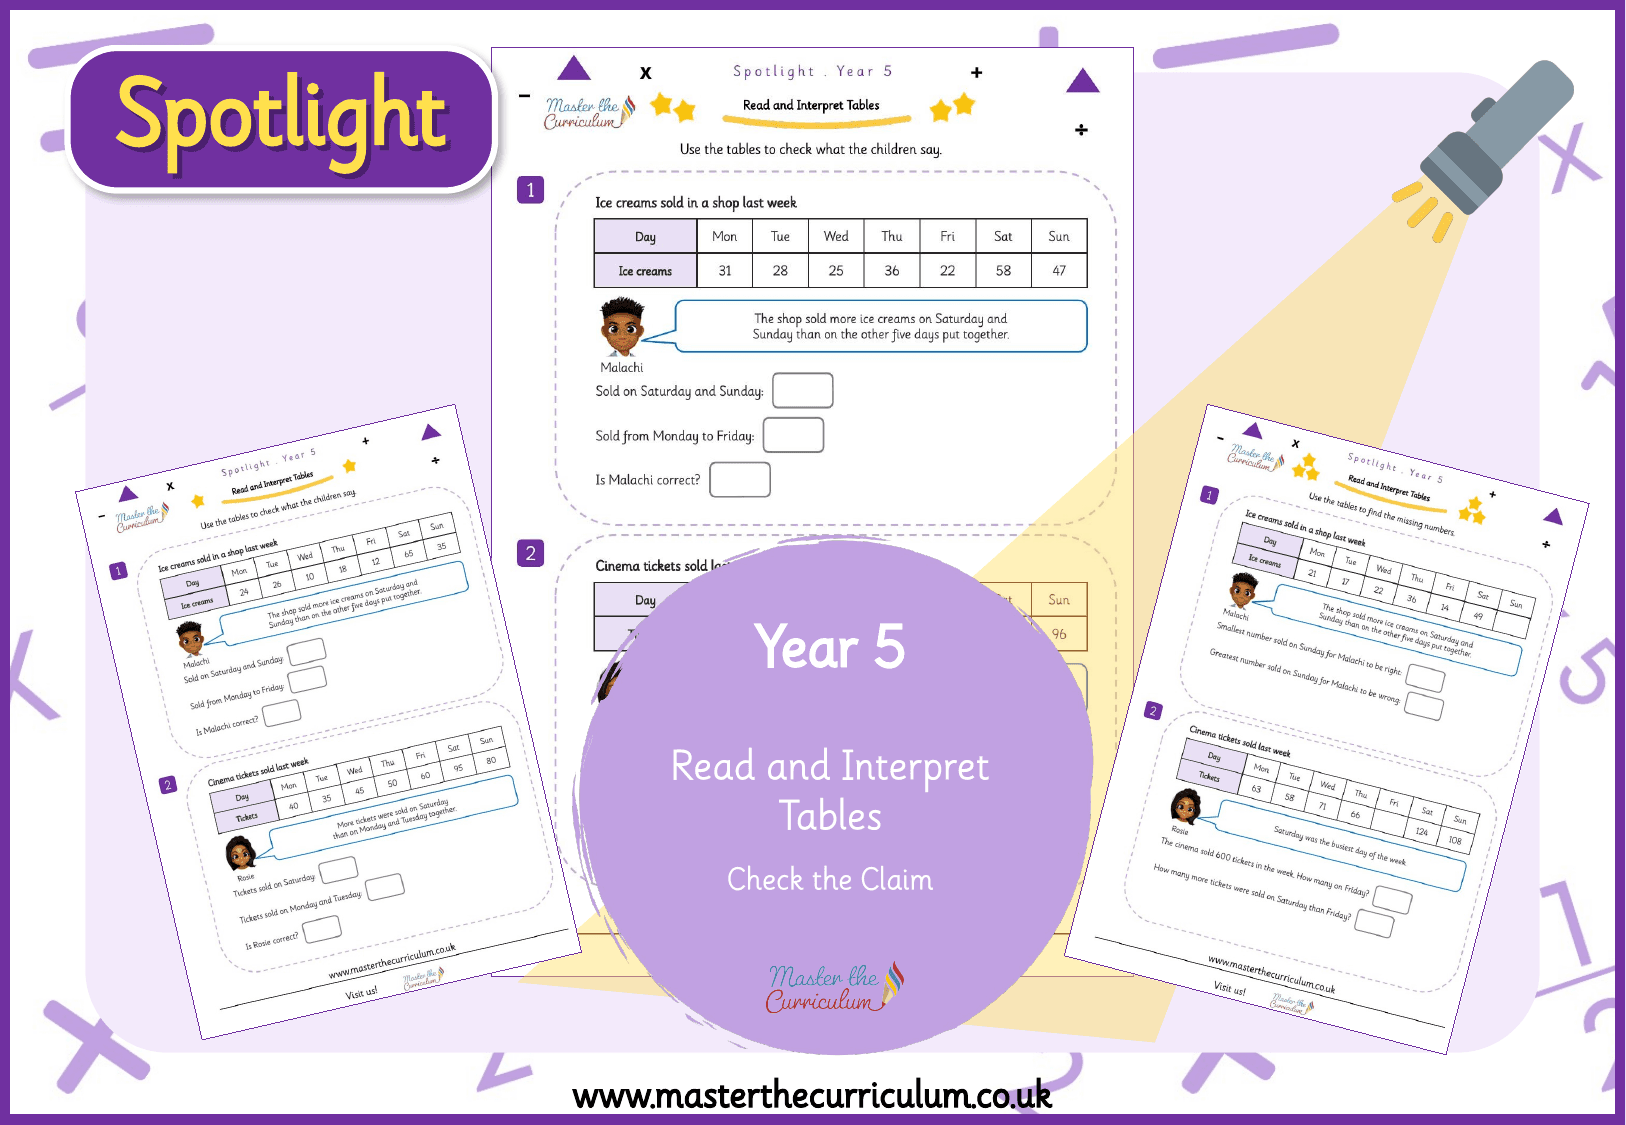
Spotlight Y5 Interpret Tables: Check the Claim
masterthecurriculum.co.uk
3 levelsIncluded with membership
Trusted by primary teachers across the UK · New resources every week
233 resources · matched on the words you typed
Statistics
masterthecurriculum.co.uk
3 levels
Statistics
masterthecurriculum.co.uk
3 levels
Statistics
masterthecurriculum.co.uk
3 levels
Statistics
masterthecurriculum.co.uk
3 levels
Statistics
masterthecurriculum.co.uk
3 levels
Statistics
masterthecurriculum.co.uk
3 levels
Statistics
masterthecurriculum.co.uk
3 levels
Statistics
masterthecurriculum.co.uk
3 levels
Statistics
masterthecurriculum.co.uk
3 levels
Statistics
masterthecurriculum.co.uk
3 levels

Statistics
masterthecurriculum.co.uk
3 levels
Statistics
masterthecurriculum.co.uk
3 levels
Statistics
masterthecurriculum.co.uk
3 levels
Statistics
masterthecurriculum.co.uk
3 levels
Statistics
masterthecurriculum.co.uk
3 levels
Statistics
masterthecurriculum.co.uk
3 levels
Statistics
masterthecurriculum.co.uk
3 levels
Statistics
masterthecurriculum.co.uk
3 levels
Statistics
masterthecurriculum.co.uk
3 levels
Statistics
masterthecurriculum.co.uk
3 levels
Statistics
masterthecurriculum.co.uk
3 levels
Statistics
masterthecurriculum.co.uk
3 levels
Statistics
masterthecurriculum.co.uk
3 levels
Statistics
masterthecurriculum.co.uk
3 levels
Statistics
masterthecurriculum.co.uk
3 levels

Statistics
masterthecurriculum.co.uk
3 levels
Statistics
masterthecurriculum.co.uk
3 levels
Statistics
masterthecurriculum.co.uk
3 levels
Statistics
masterthecurriculum.co.uk
3 levels
Statistics
masterthecurriculum.co.uk
3 levels
Statistics
masterthecurriculum.co.uk
3 levels


Statistics
masterthecurriculum.co.uk
3 levels
Statistics
masterthecurriculum.co.uk
3 levels
Statistics
masterthecurriculum.co.uk
3 levels
Statistics
masterthecurriculum.co.uk
3 levels
Statistics
masterthecurriculum.co.uk
3 levels
Statistics
masterthecurriculum.co.uk
3 levels
Statistics
masterthecurriculum.co.uk
3 levels
Statistics
masterthecurriculum.co.uk
3 levels
Statistics
masterthecurriculum.co.uk
3 levels

Showing 97 to 144 of 233 results · page 3 of 5