L5 Sorting and Comparing Data
Included with membership
Trusted by primary teachers across the UK · New resources every week
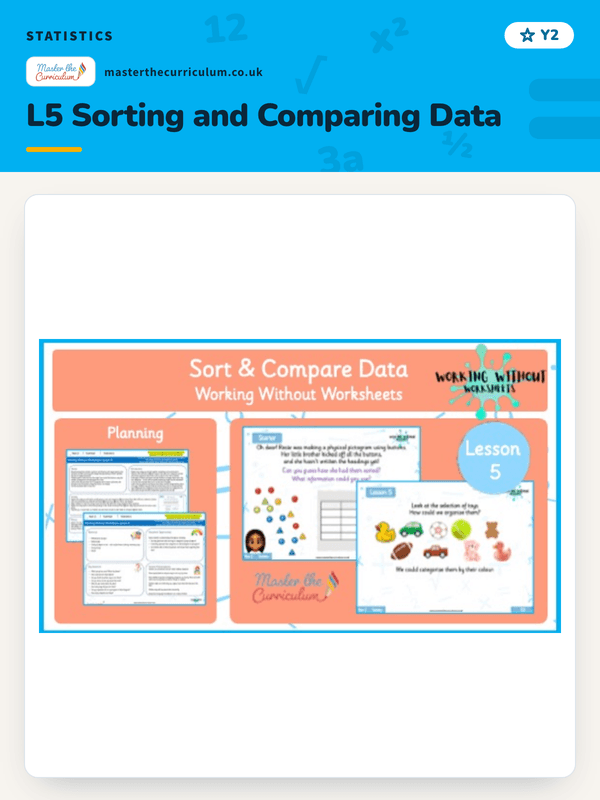
A fun, hands-on Year 2 statistics lesson introducing tally charts. Children learn to collect, record, and interpret data using tally marks in groups of five through real-world investigations and interactive activities.
Preview only. The download is 4 files, listed in full below.
Free, in full. Make a free account and the file downloads on this page, with nothing held back.
Free
One of our free samples. This is a premium resource, in full, with nothing held back, so you can see exactly what membership buys before you pay for any of it.
No card, now or ever, for a free resource. Already have an account? Log in and it downloads from this page.
Keep it for later and group it with the rest of the block. No account needed to start.
This engaging Year 2 statistics lesson introduces children to tally charts through a hands-on, investigative approach that makes data collection and counting fun and meaningful. Building on previous lessons about pictograms, this Working Without Worksheets lesson helps pupils understand how to collect, record, and interpret data in real time using tally marks. The lesson begins with a practical starter revisiting pictograms and missing data problems, helping children recall how information is represented visually. During the teaching input, pupils learn that a tally chart is a tool used to record changing data quickly — for example, cars passing by or children entering a hall. The teacher models how to group tallies into gates of five, reinforcing counting in 5s and accuracy when handling larger quantities. Children then take part in an active data collection task, where they either record cars passing by outside the school or use an animated classroom version to simulate this. They’ll practise making tally marks in real time, counting carefully, and grouping data efficiently. The lesson concludes with a shared discussion on Leanna’s tally chart, showing the importance of grouping in fives and interpreting results to identify which category has the most or least data. This lesson supports mastery in interpreting and constructing simple tally charts — a key Year 2 maths objective — and builds fluency in counting in 5s, understanding data organisation, and interpreting real-world information. What’s Included in the Pack ✔ Full lesson plan with objectives, key questions, misconceptions, and assessment prompts ✔ Fully animated teaching slides for interactive modelling ✔ Starter: Missing data from pictograms activity ✔ Teaching input: Introduction to tally charts and the 5-bar gate method ✔ Two activity options – outdoor car count or indoor animated data collection ✔ Plenary: Review and correct a misgrouped tally chart ✔ Practical, active, and worksheet-free data handl
This pack is listed as editable, so the editable copy comes with it. We do not print page counts here, because our catalogue does not publish them and a guessed number is worse than none.
Working Without Worksheets, Year 211 numbered lessons