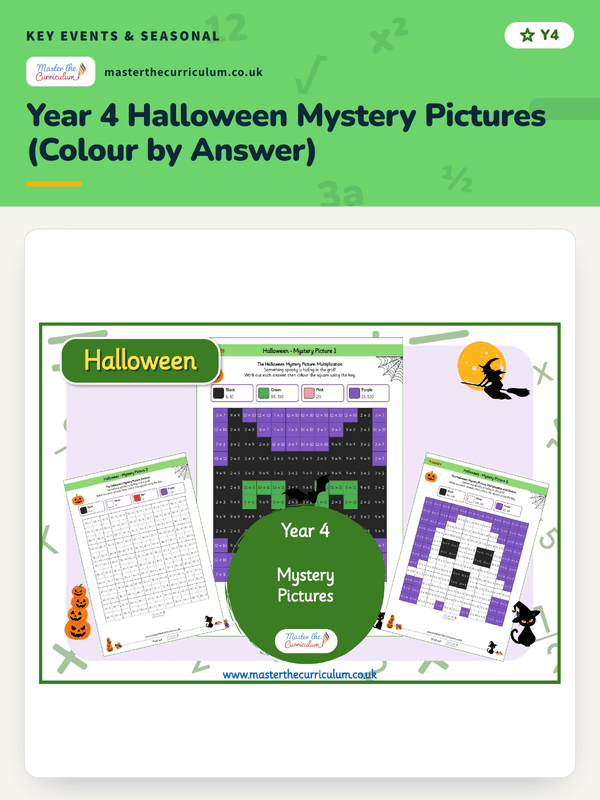
Year 4 Halloween Mystery Pictures (Colour by Answer)
Included with membership
Trusted by primary teachers across the UK · New resources every week
A practical Year 3/4 statistics activity where pupils tally passing cars by colour and present their data in a bar chart. Great for real-world maths learning.
Preview only. The download is one file, listed in full below.
Every page is shown before you download. The files themselves come with membership, or sign in if you already have one.
Included with membership
Unlock with membershipAlready a member? Sign in and it downloads from this page.
Keep it for later and group it with the rest of the block. No account needed to start.
Make statistics meaningful and engaging with this Traffic Tally activity for Year 3 and Year 4 ! Designed to support key maths objectives, this practical resource encourages children to collect and analyse real-world data in a safe, supervised outdoor environment. Pupils observe passing traffic from a safe pavement location and record the number of different coloured cars they see over a 15-minute period. They then organise their findings using a tally chart and present their data clearly by creating a bar chart with an appropriate scale. This activity is perfect for developing skills in data collection, data representation, and interpretation, while also promoting observation and critical thinking. It’s an excellent way to connect classroom learning with real-life contexts and keep children actively engaged. Safety is a priority, so adult supervision is required at all times, and quieter roads are recommended for data collection. Ideal for teachers looking for a hands-on statistics lesson that combines maths with real-world learning.
This pack is print and go. Our catalogue does not list an editable copy of it, so none is offered here rather than promising a file nobody has opened. Page counts are not printed either, because we do not publish them and a guessed number is worse than none.