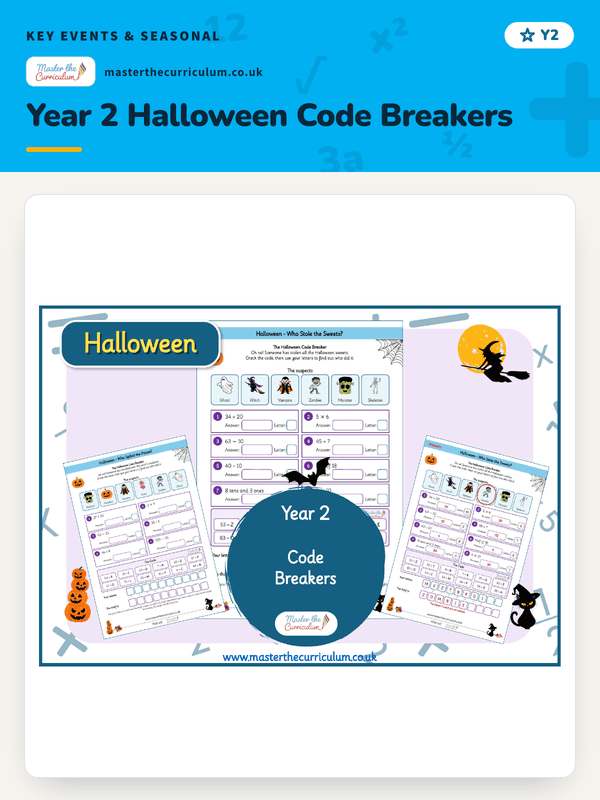
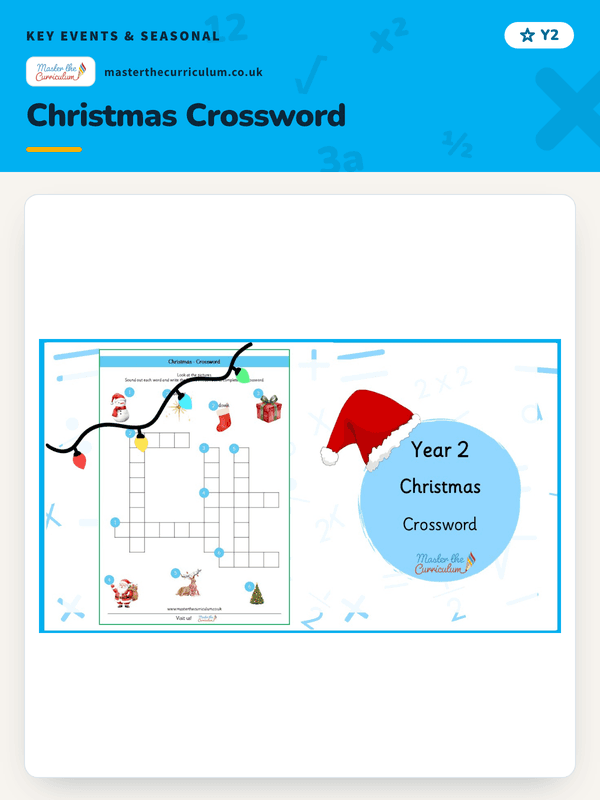
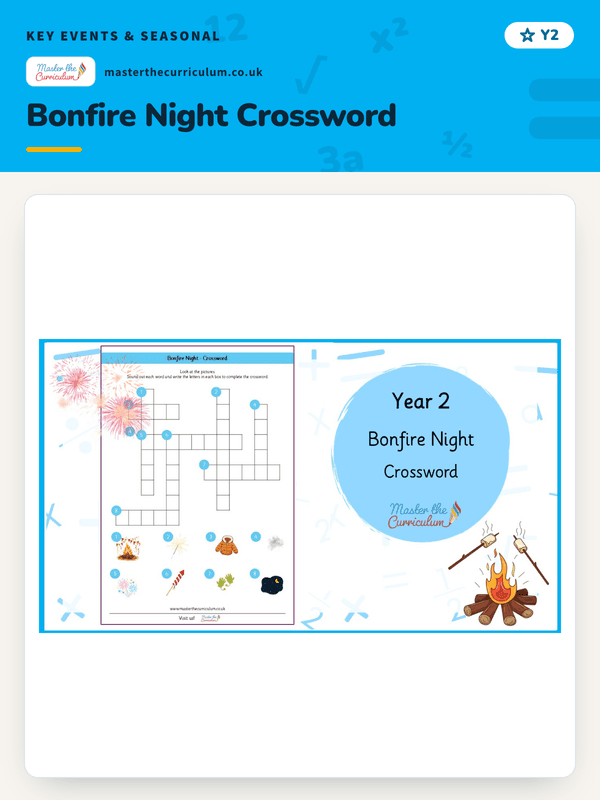
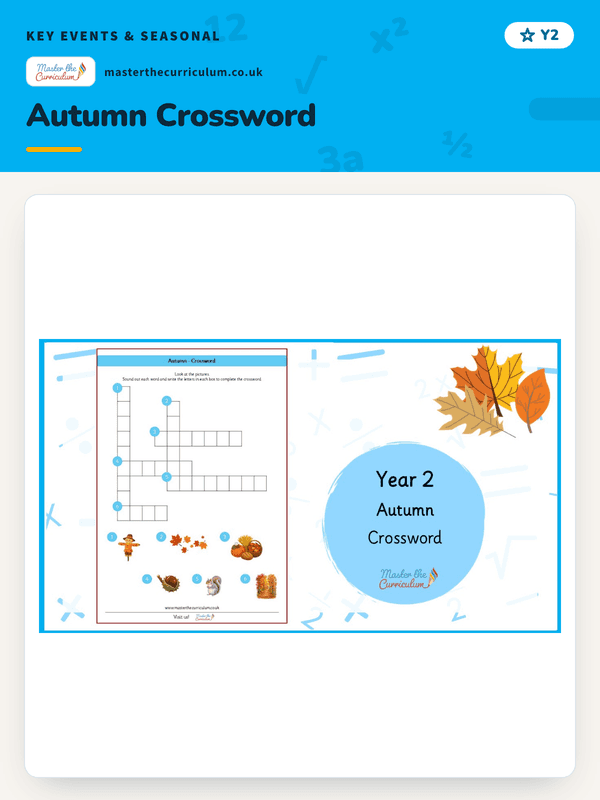
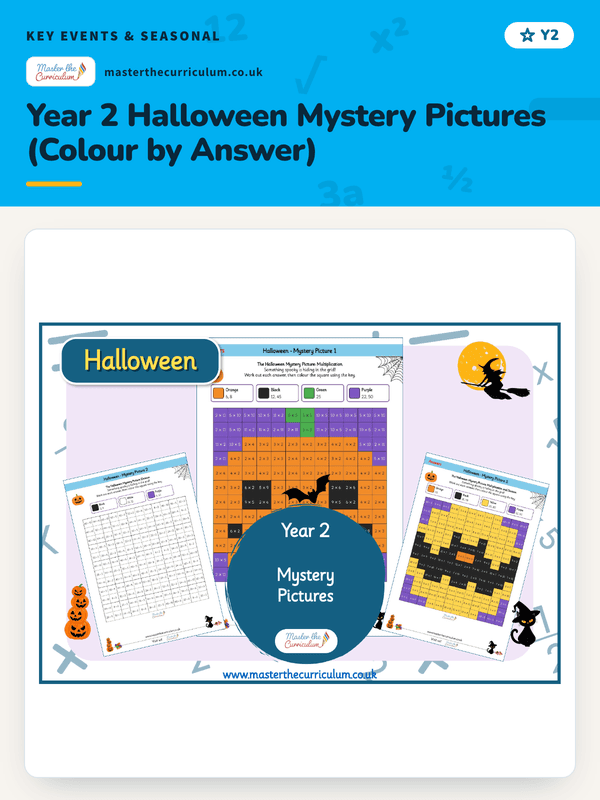
Year 2 Halloween Mystery Pictures (Colour by Answer)
Included with membership
Trusted by primary teachers across the UK · New resources every week
A fun, hands-on Year 2 activity where students count flowers in a park or school field, record data in a tally chart, and create a pictogram. Perfect for teaching statistics through outdoor learning.
Preview only. The download is one file, listed in full below.
Every page is shown before you download. The files themselves come with membership, or sign in if you already have one.
Included with membership
Unlock with membershipAlready a member? Sign in and it downloads from this page.
Keep it for later and group it with the rest of the block. No account needed to start.
Engage your Year 2 students with this interactive Plant Pictograms activity, designed to bring statistics to life! Perfect for children towards the end of Year 2, this hands-on resource helps students practice data collection, tally charts, and pictograms while exploring nature. Students can visit a local park or the school field, use a hula hoop or tape measure to create a circle on the grass, and count daisies, buttercups, and dandelions within the area. They then record their findings in a tally chart and represent the data visually using a pictogram. This activity encourages outdoor learning, promotes observation skills, and supports the development of key statistics objectives in a fun, engaging way. Ideal for teachers looking to combine math, science, and outdoor education.
This pack is print and go. Our catalogue does not list an editable copy of it, so none is offered here rather than promising a file nobody has opened. Page counts are not printed either, because we do not publish them and a guessed number is worse than none.