“Statistics”
33 resources · matched on the words you typed · Year 4
Narrow it
More ways to narrow▾
Year 4- Statistics Vocabulary and Assessment

Year 4 – Summer – Week 2 – Editable Statistics Differentiated Sheets

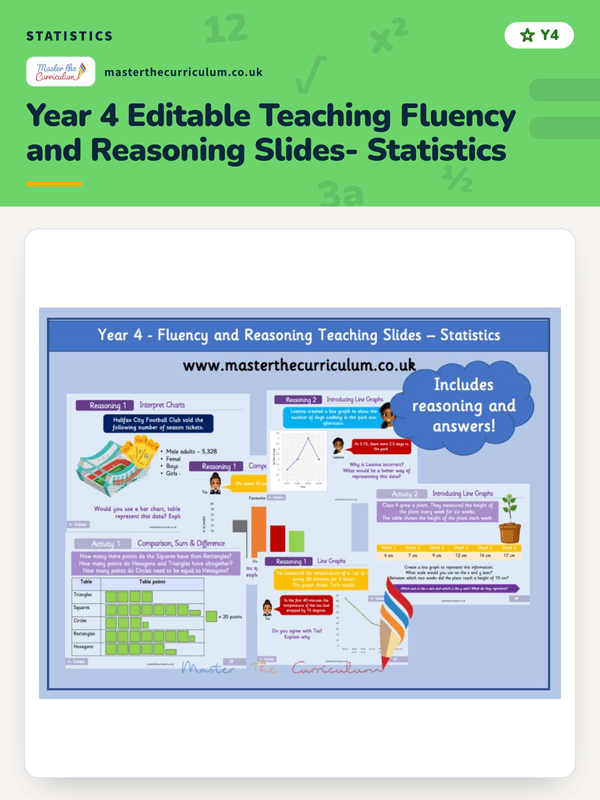
Year 4 Editable Teaching Fluency and Reasoning Slides- Statistics
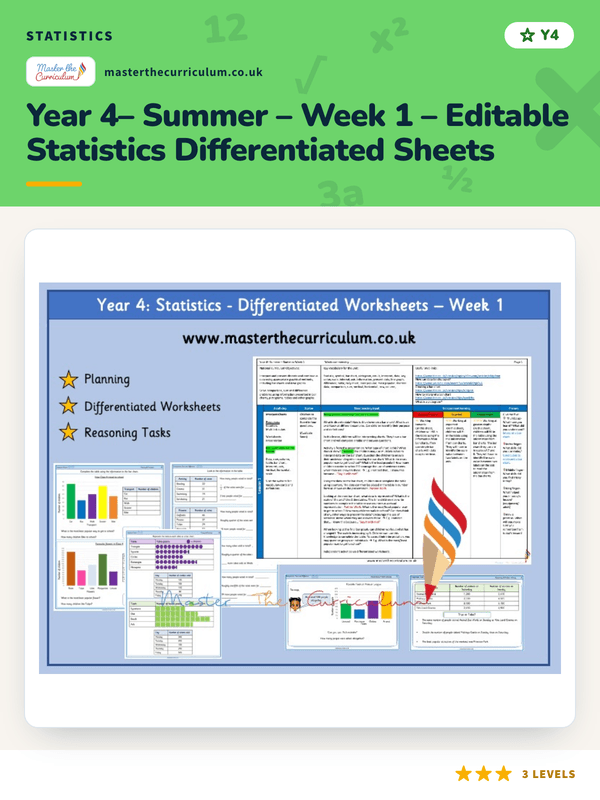
Year 4– Summer – Week 1 – Editable Statistics Differentiated Sheets
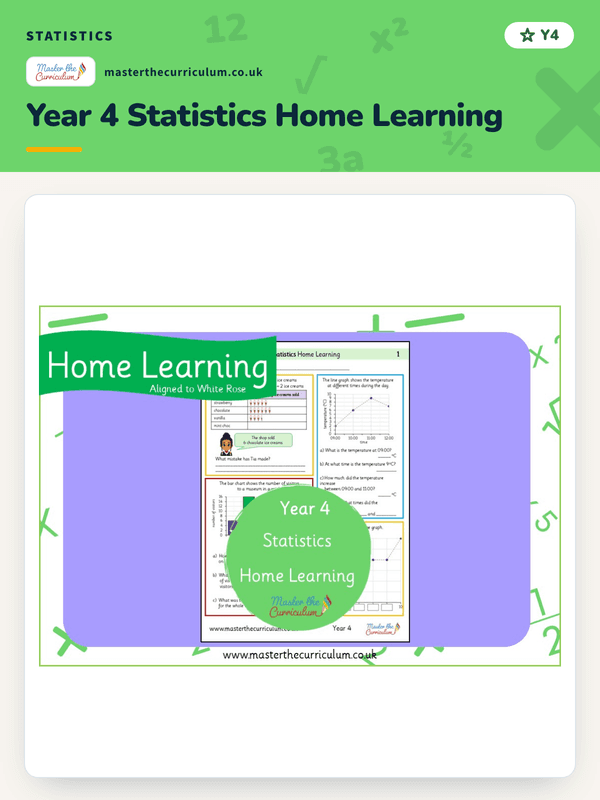
Year 4 Statistics Home Learning
Year 4 Statistics Maths Assessment

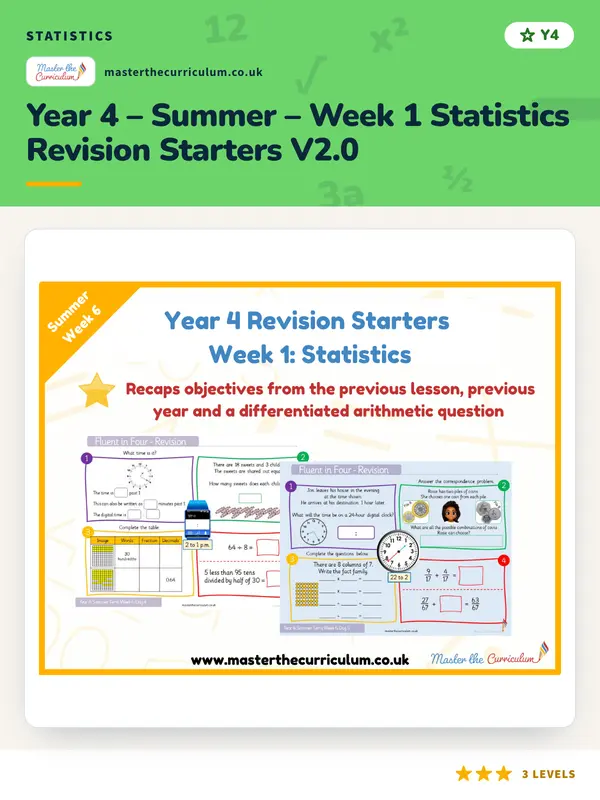
Year 4 – Summer – Week 1 Statistics Revision Starters V2.0
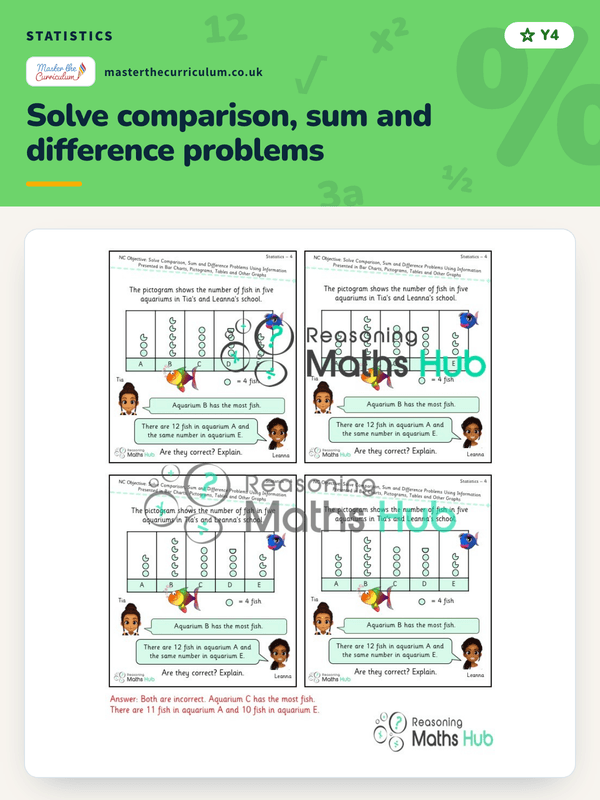
Solve comparison, sum and difference problems
Spotlight Y4 Interpret Charts: Which Chart?
masterthecurriculum.co.uk
★★★3 levelsInterpret and present discrete and continuous data

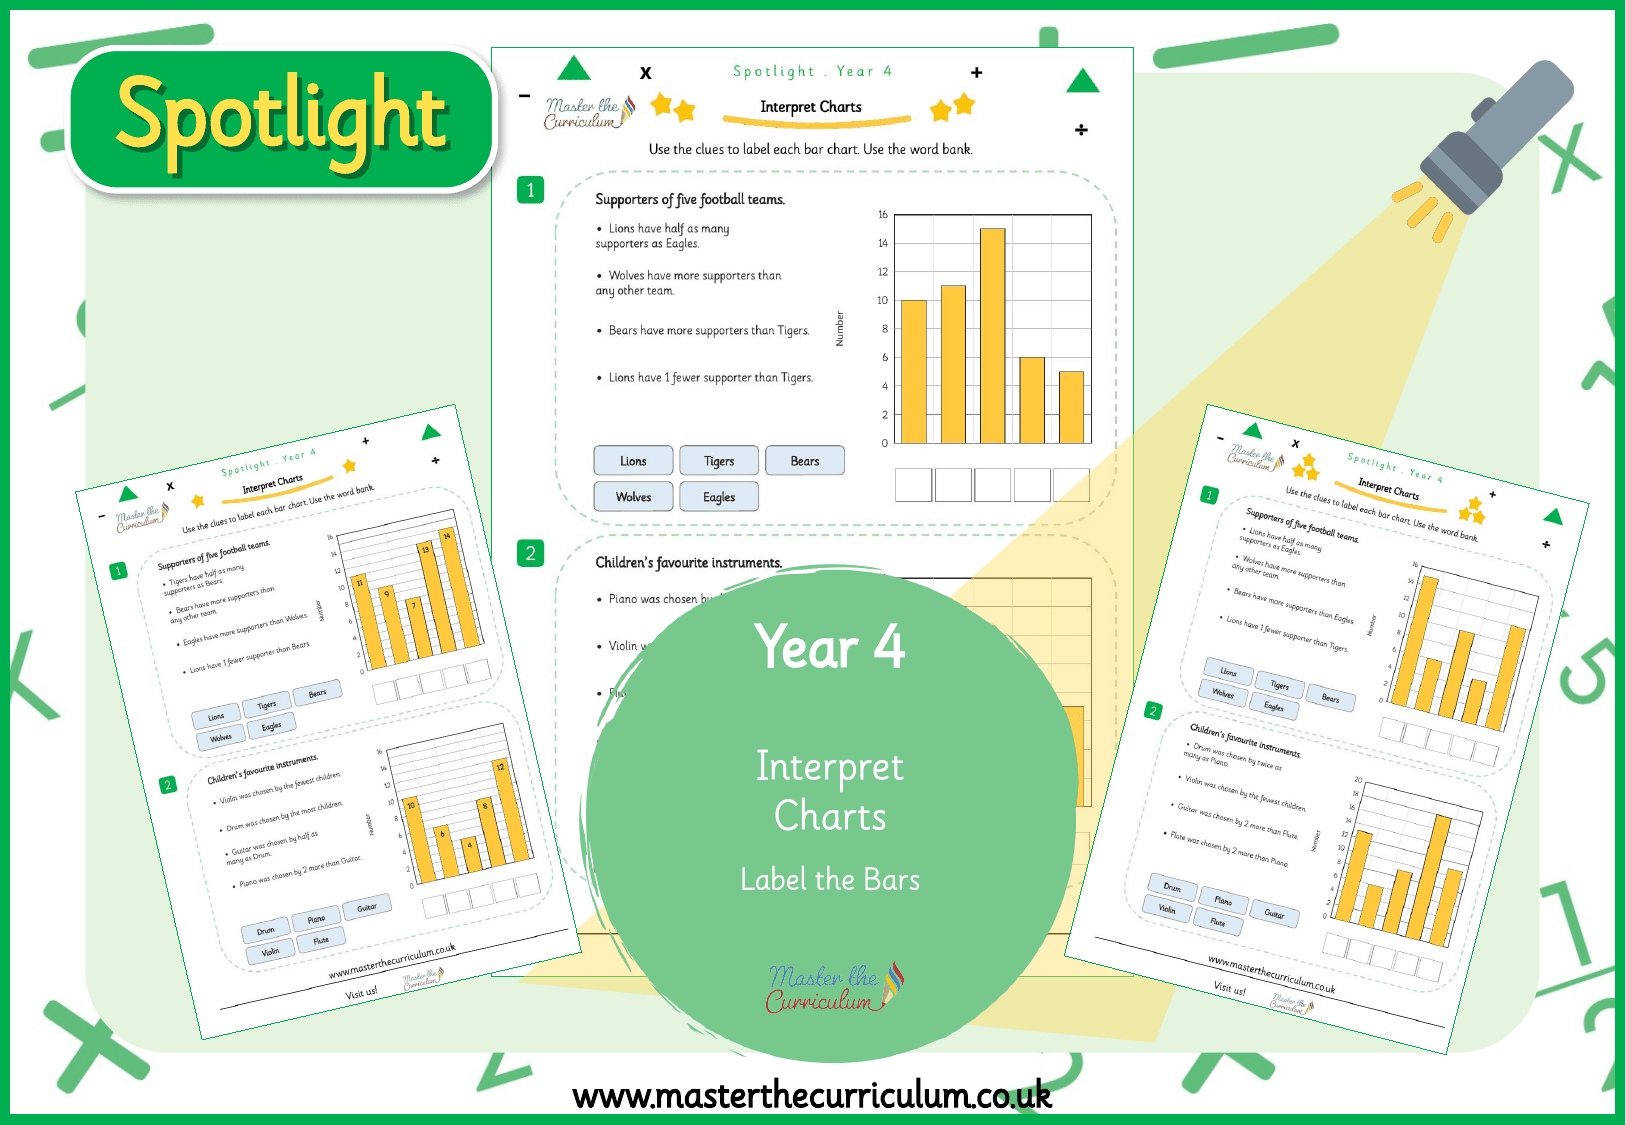
Spotlight Y4 Interpret Charts: Label the Bars
masterthecurriculum.co.uk
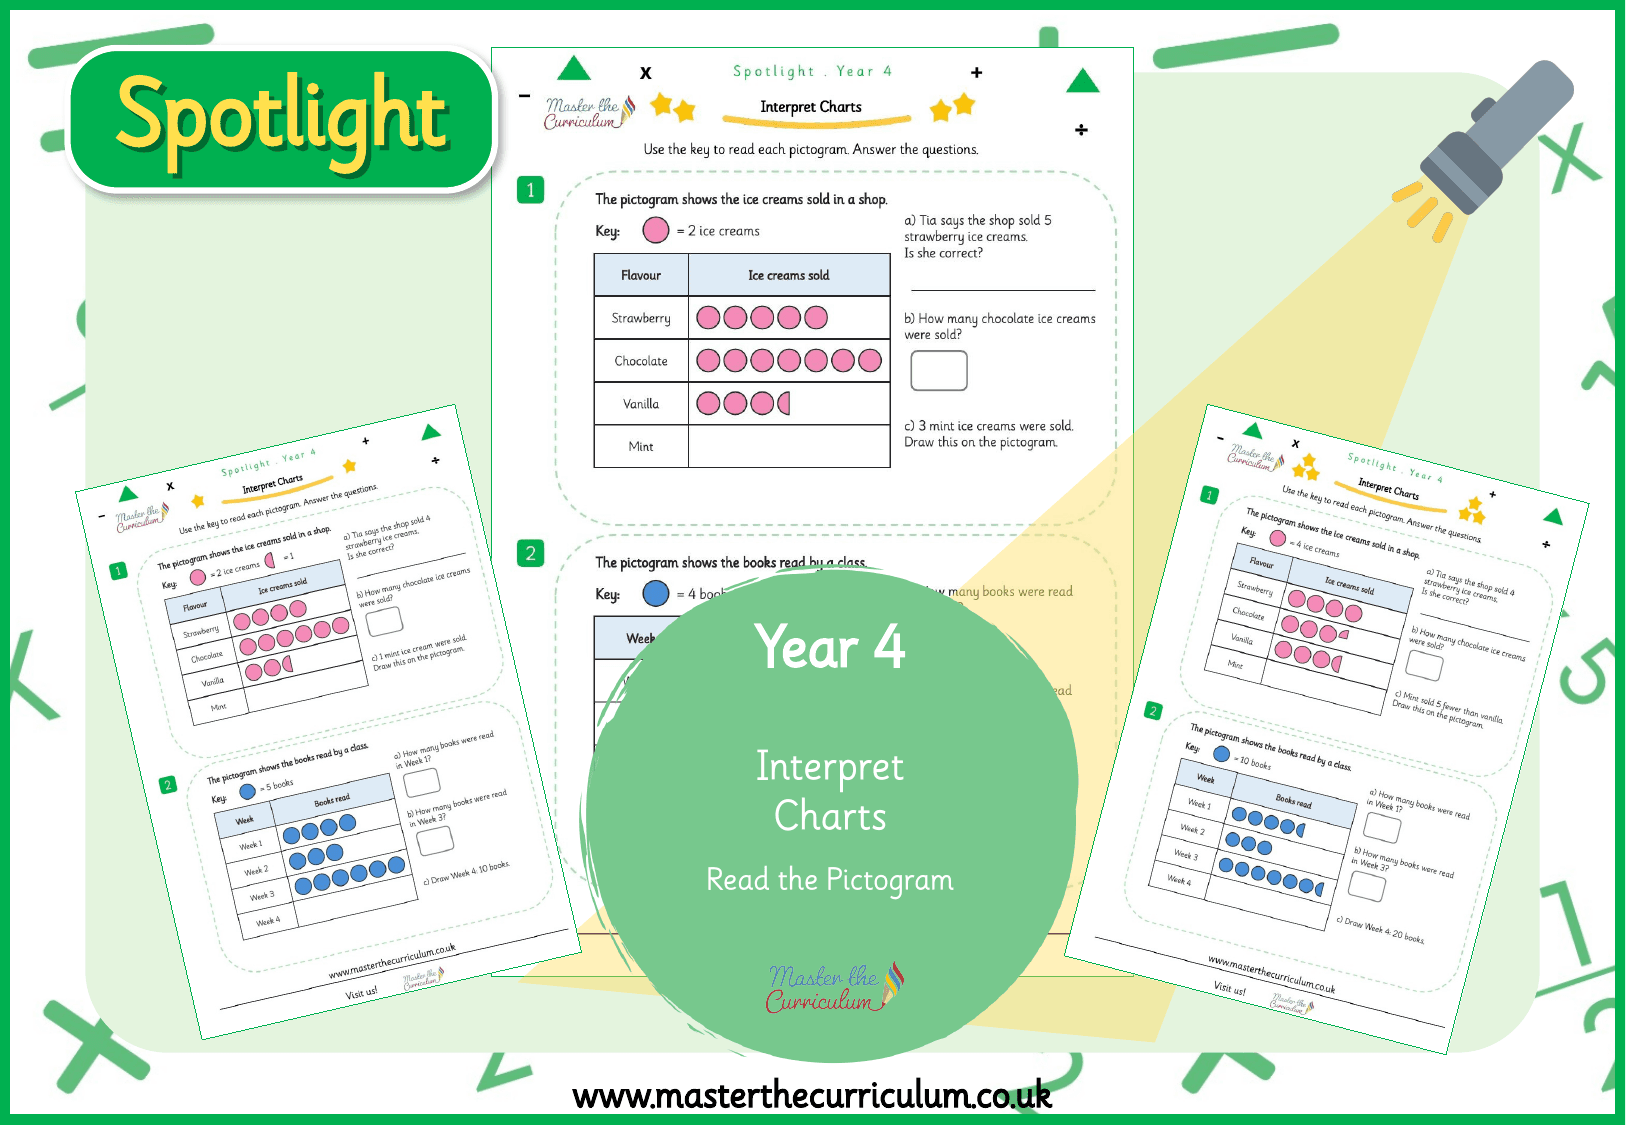
★★★3 levelsSpotlight Y4 Interpret Charts: Read the Pictogram
masterthecurriculum.co.uk
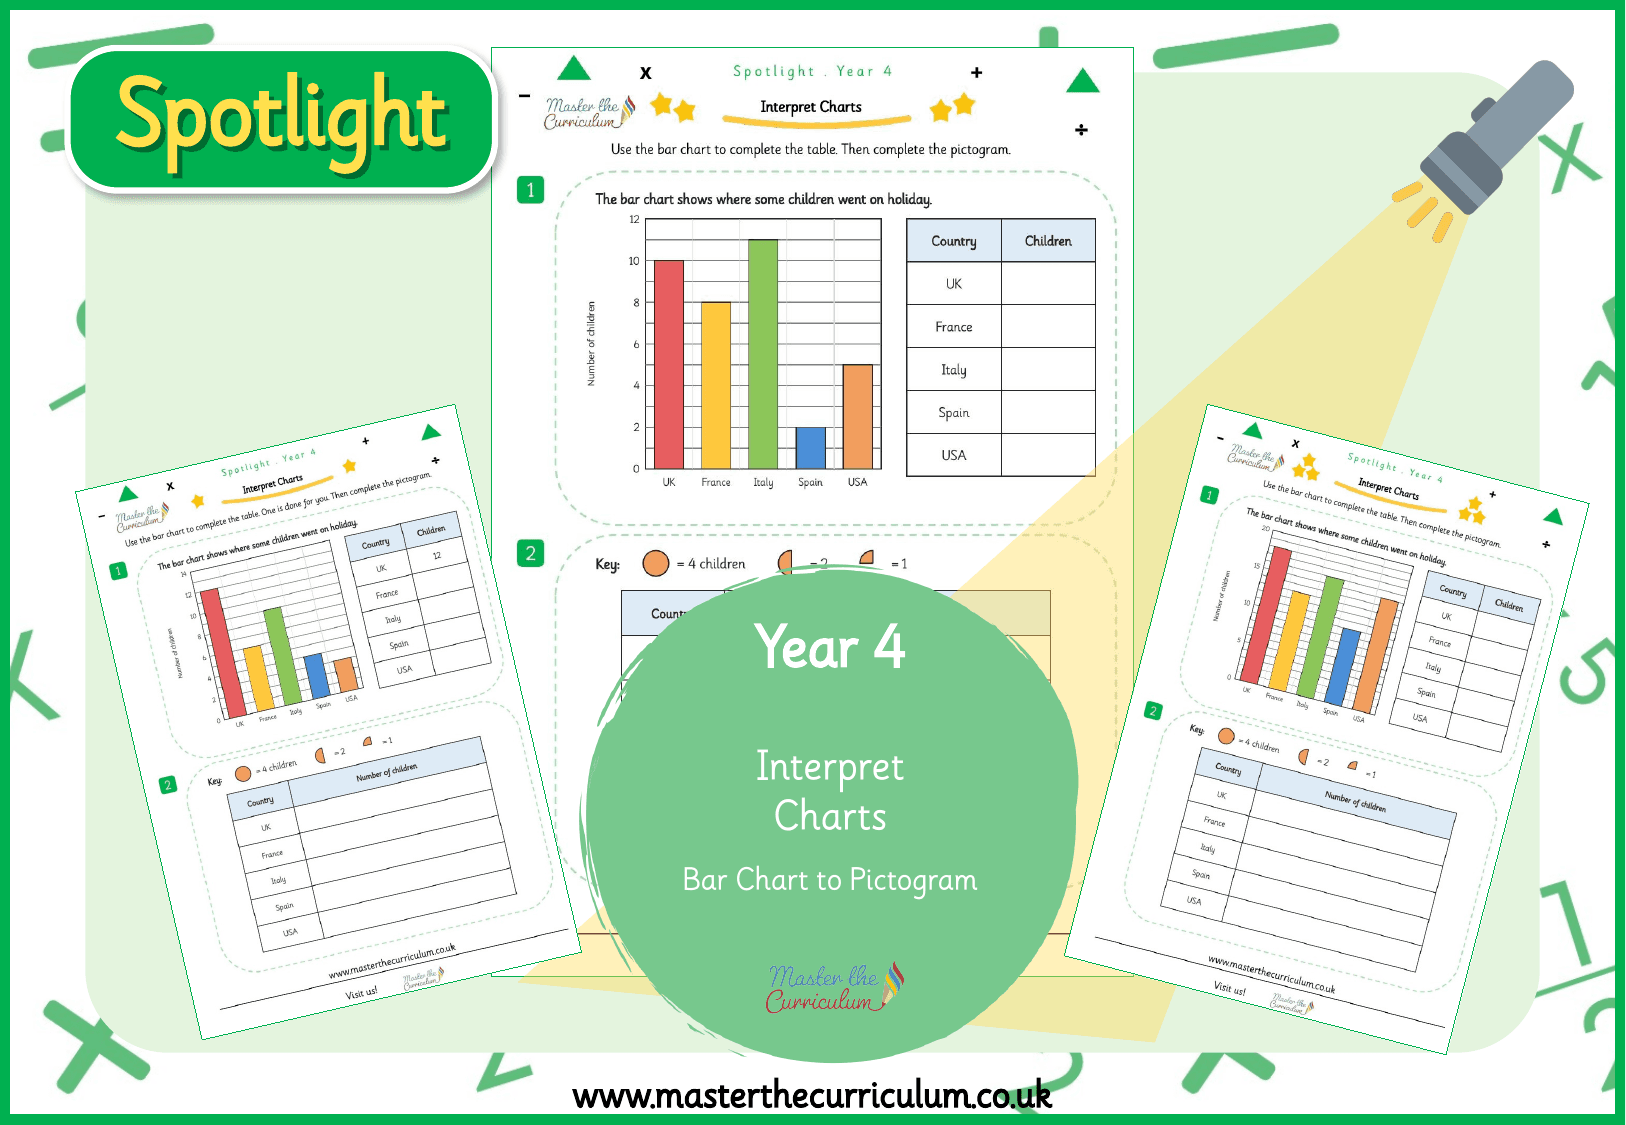
★★★3 levelsSpotlight Y4 Interpret Charts: Bar Chart to Pictogram
masterthecurriculum.co.uk
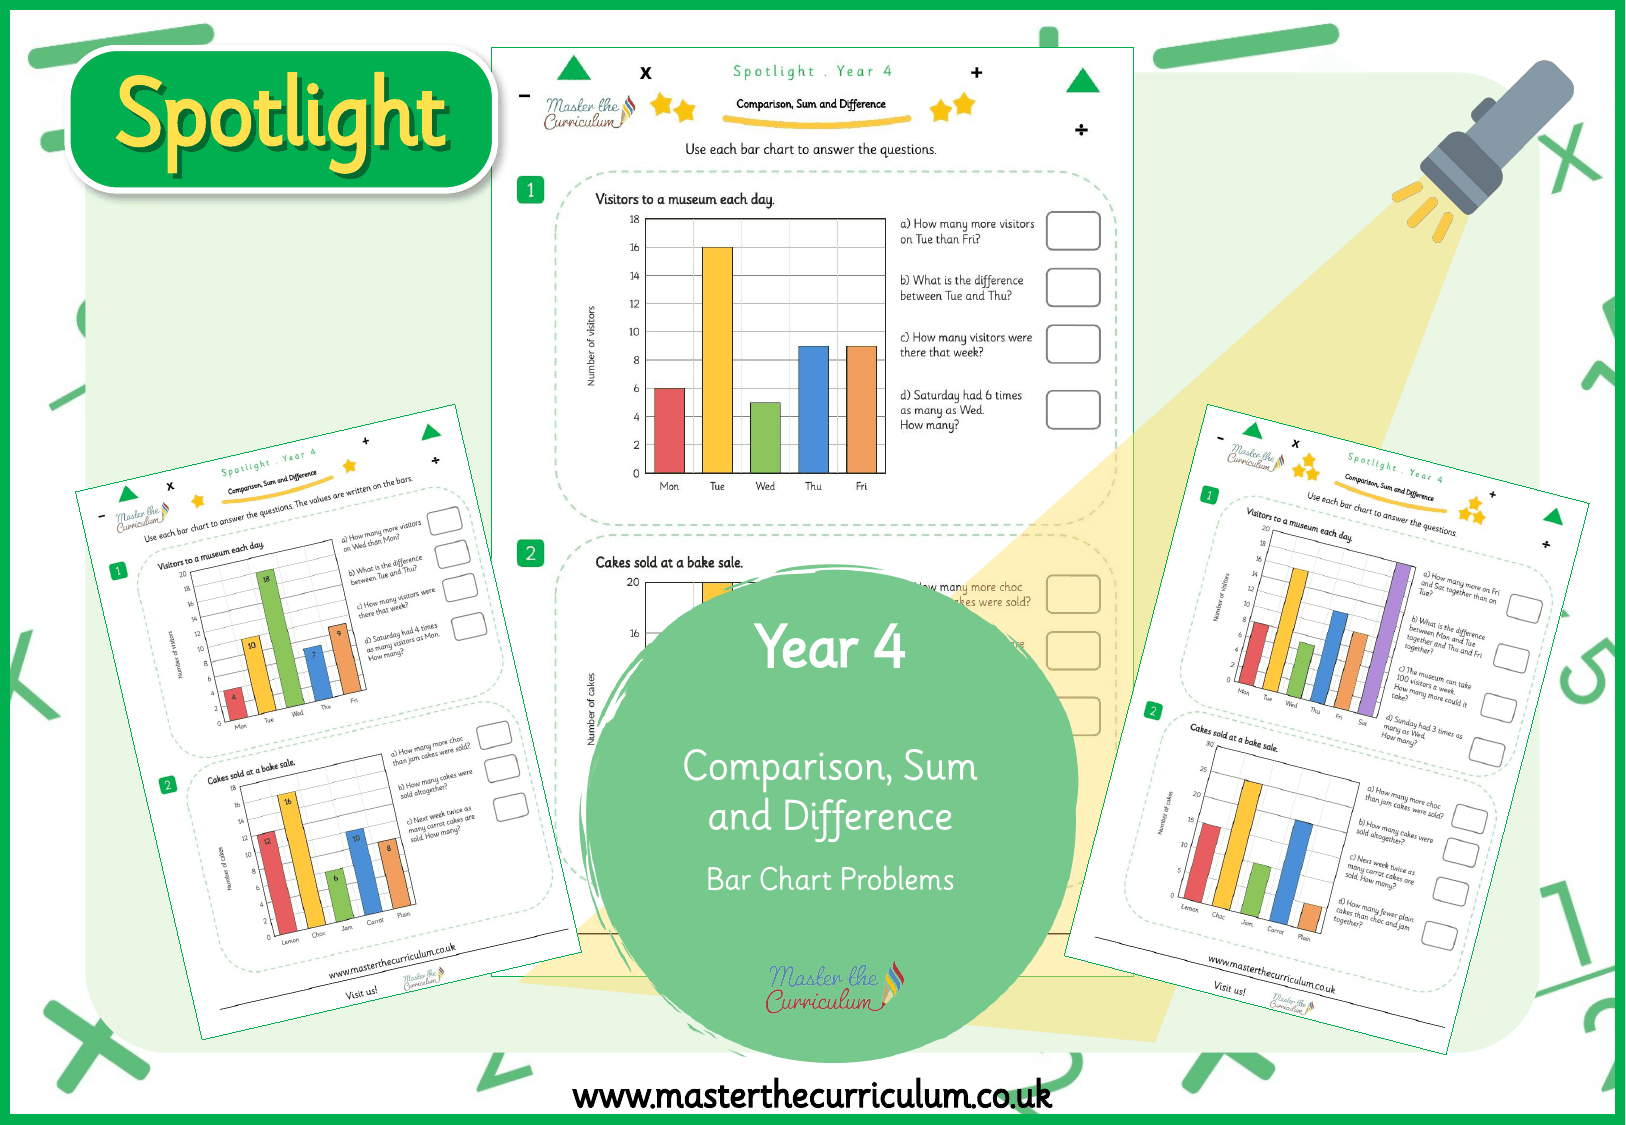
★★★3 levelsSpotlight Y4 Comparison, Sum and Difference: Bar Chart Problems
masterthecurriculum.co.uk
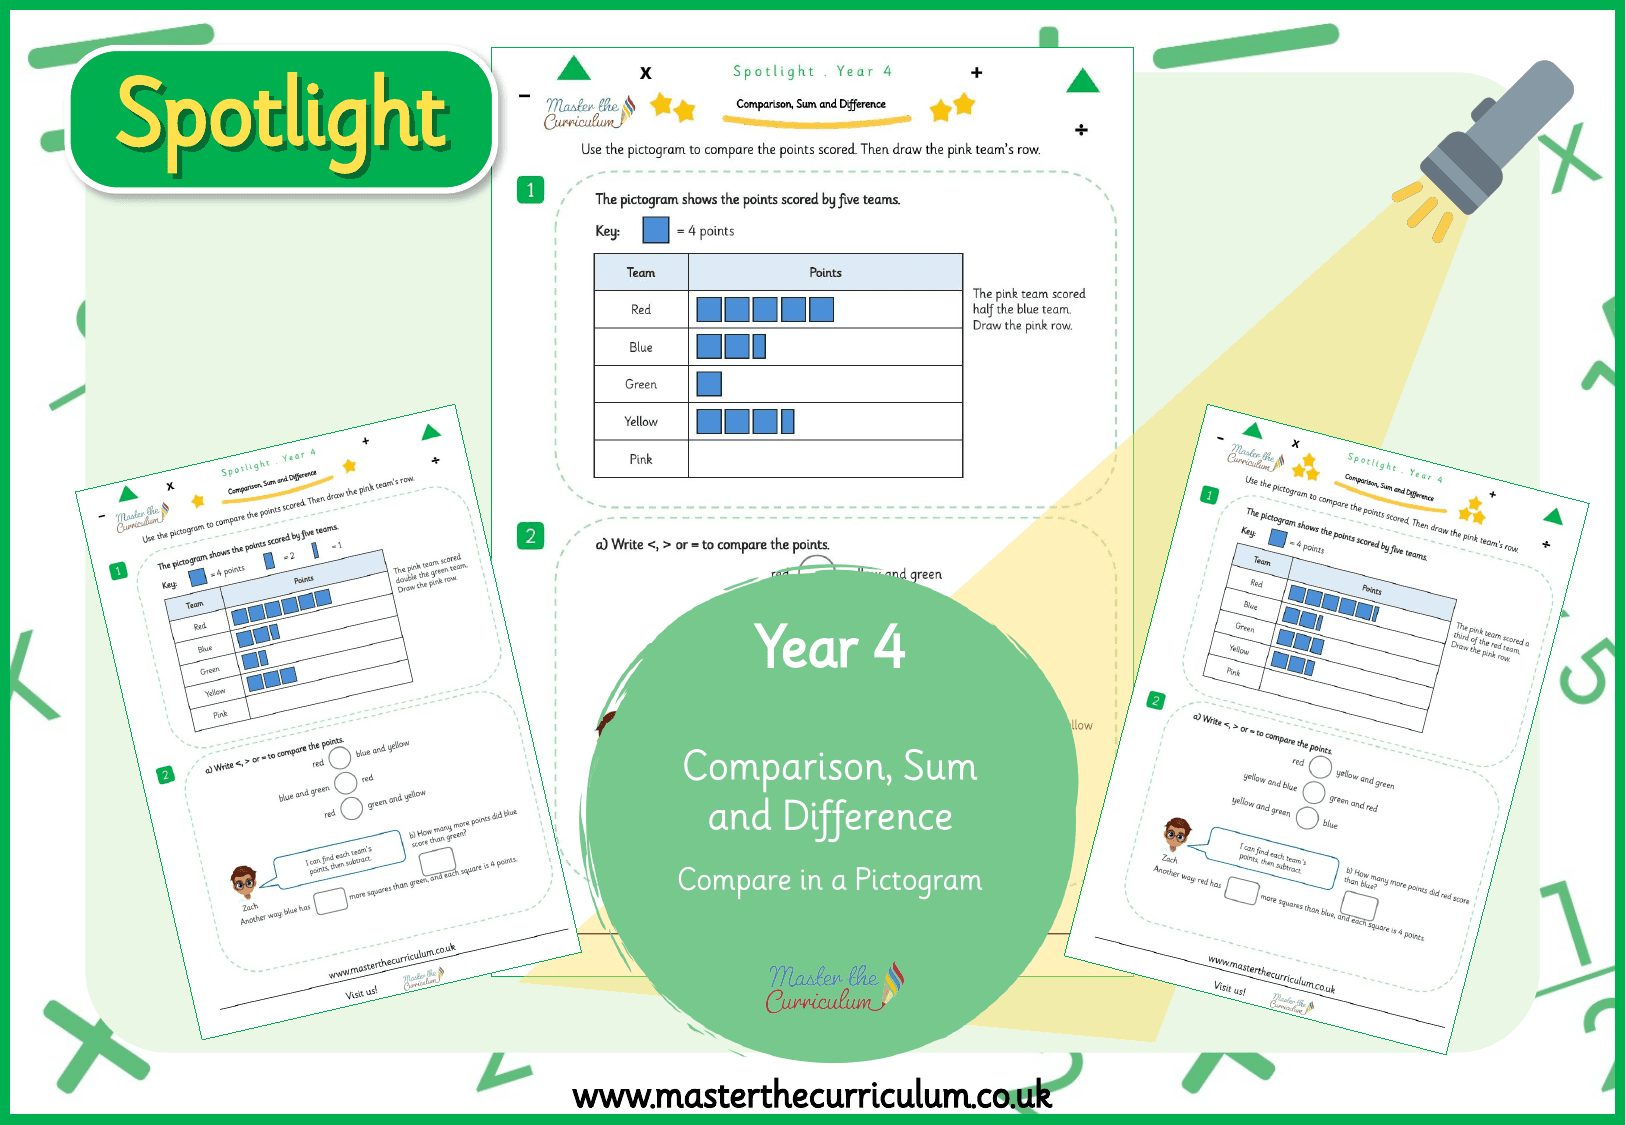
★★★3 levelsSpotlight Y4 Comparison, Sum and Difference: Compare in a Pictogram
masterthecurriculum.co.uk
★★★3 levelsSpotlight Y4 Comparison, Sum and Difference: Two Ways to Total
masterthecurriculum.co.uk
★★★3 levelsSolve comparison, sum and difference problems using information presented in bar charts, pictograms, tables and other graphs
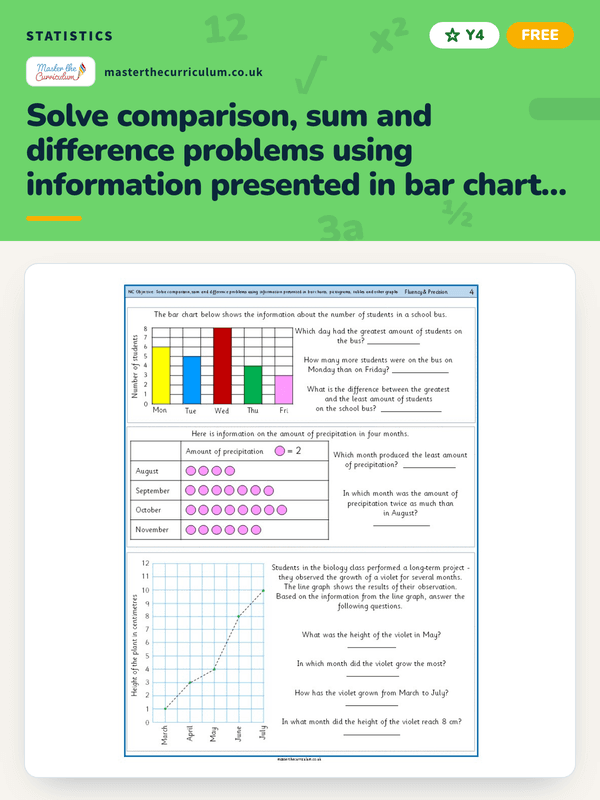
Interpret and present discrete and continuous data using appropriate graphical methods, including bar charts and time graphs – 1
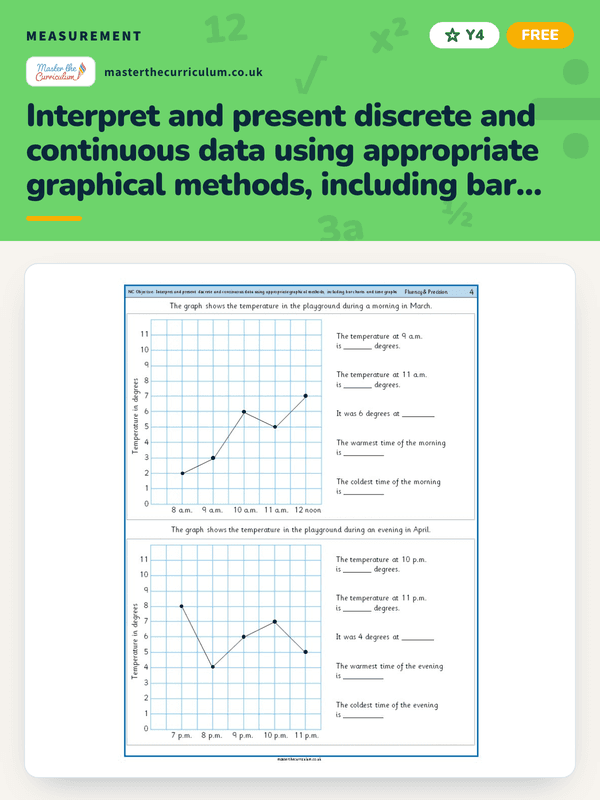
Interpret and present discrete and continuous data using appropriate graphical methods, including bar charts and time graphs – 2
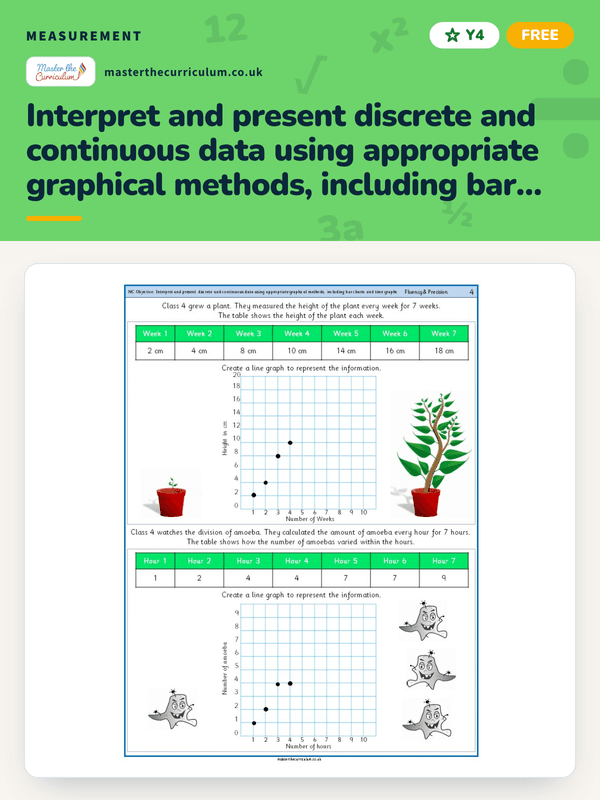
Interpret and present discrete and continuous data using appropriate graphical methods, including bar charts and time graphs – 3
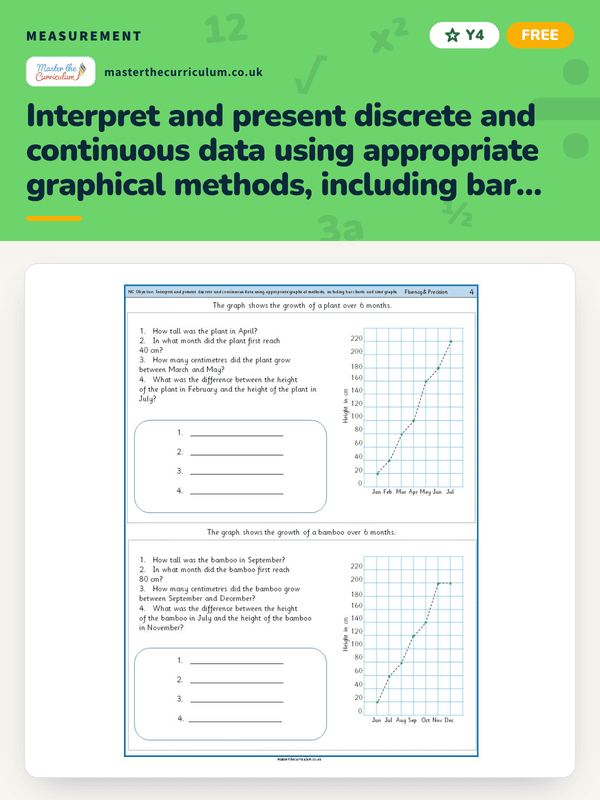
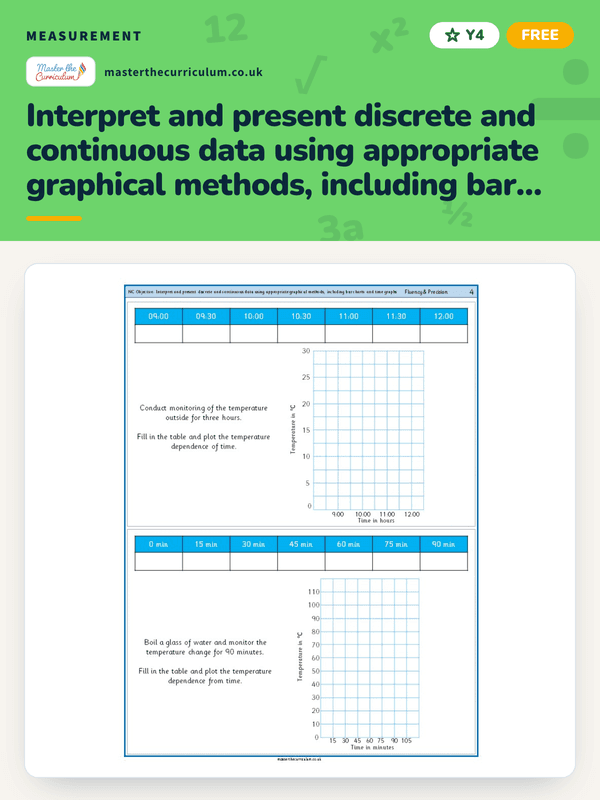
Interpret and present discrete and continuous data using appropriate graphical methods, including bar charts and time graphs – 4
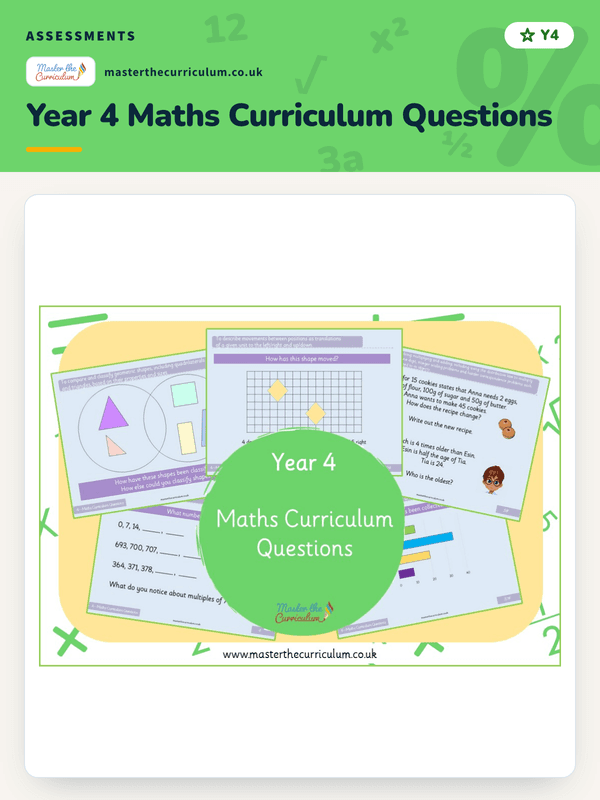
Year 4 Maths Curriculum Questions
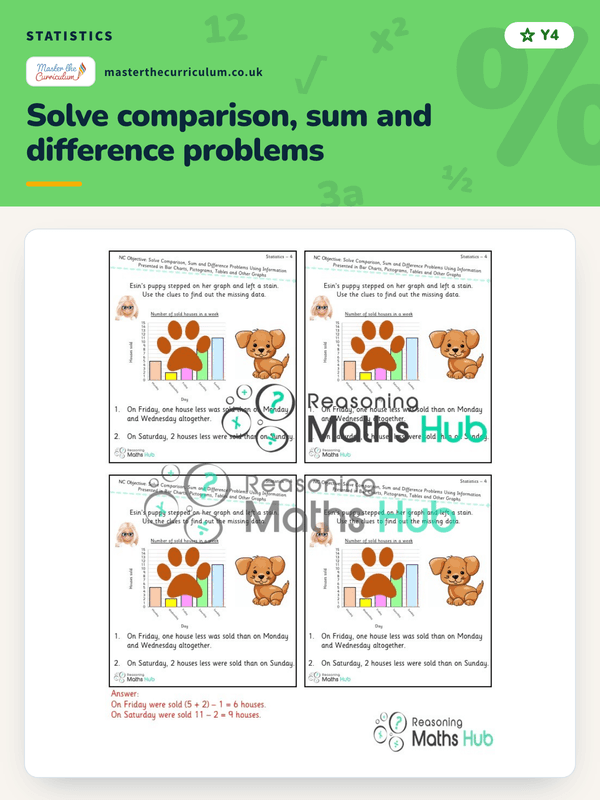
Solve comparison, sum and difference problems
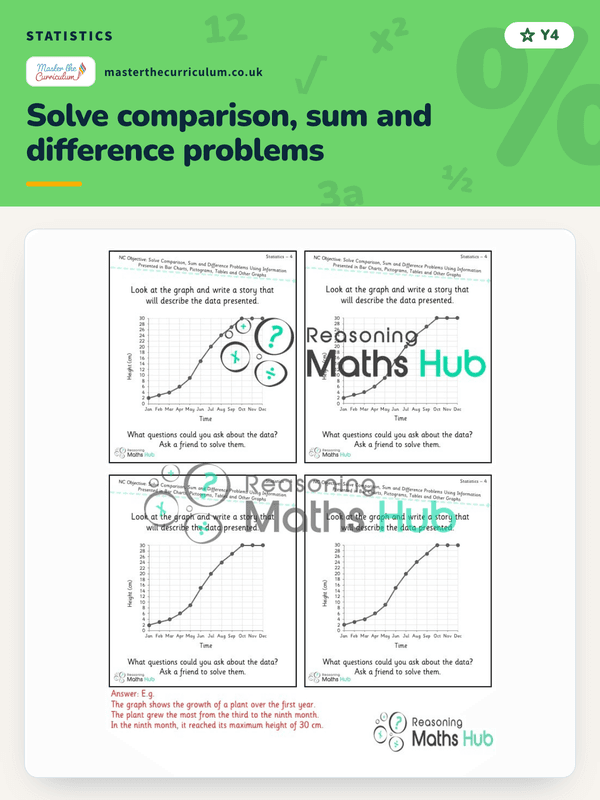
Solve comparison, sum and difference problems
Solve comparison, sum and difference problems
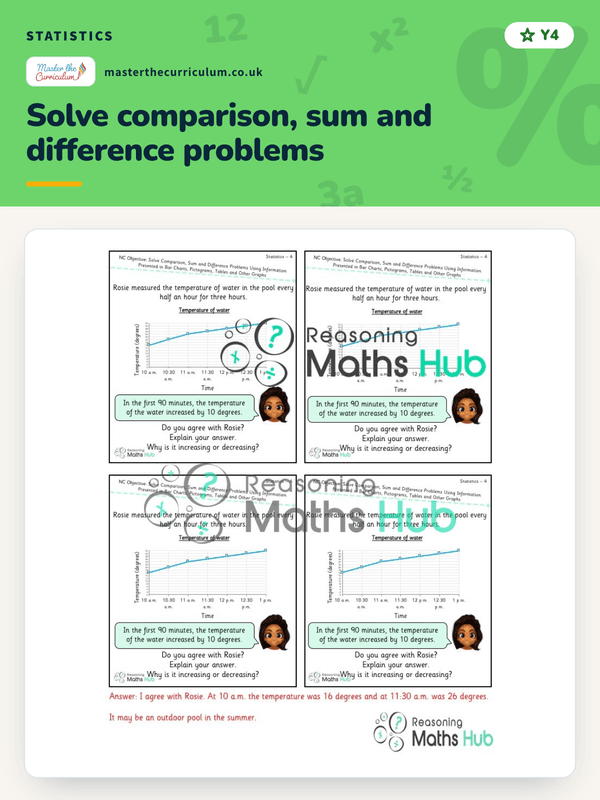
Solve comparison, sum and difference problems

Solve comparison, sum and difference problems

Interpret and present discrete and continuous data

Interpret and present discrete and continuous data

Interpret and present discrete and continuous data

Interpret and present discrete and continuous data

Showing 1 to 33 of 33 results