
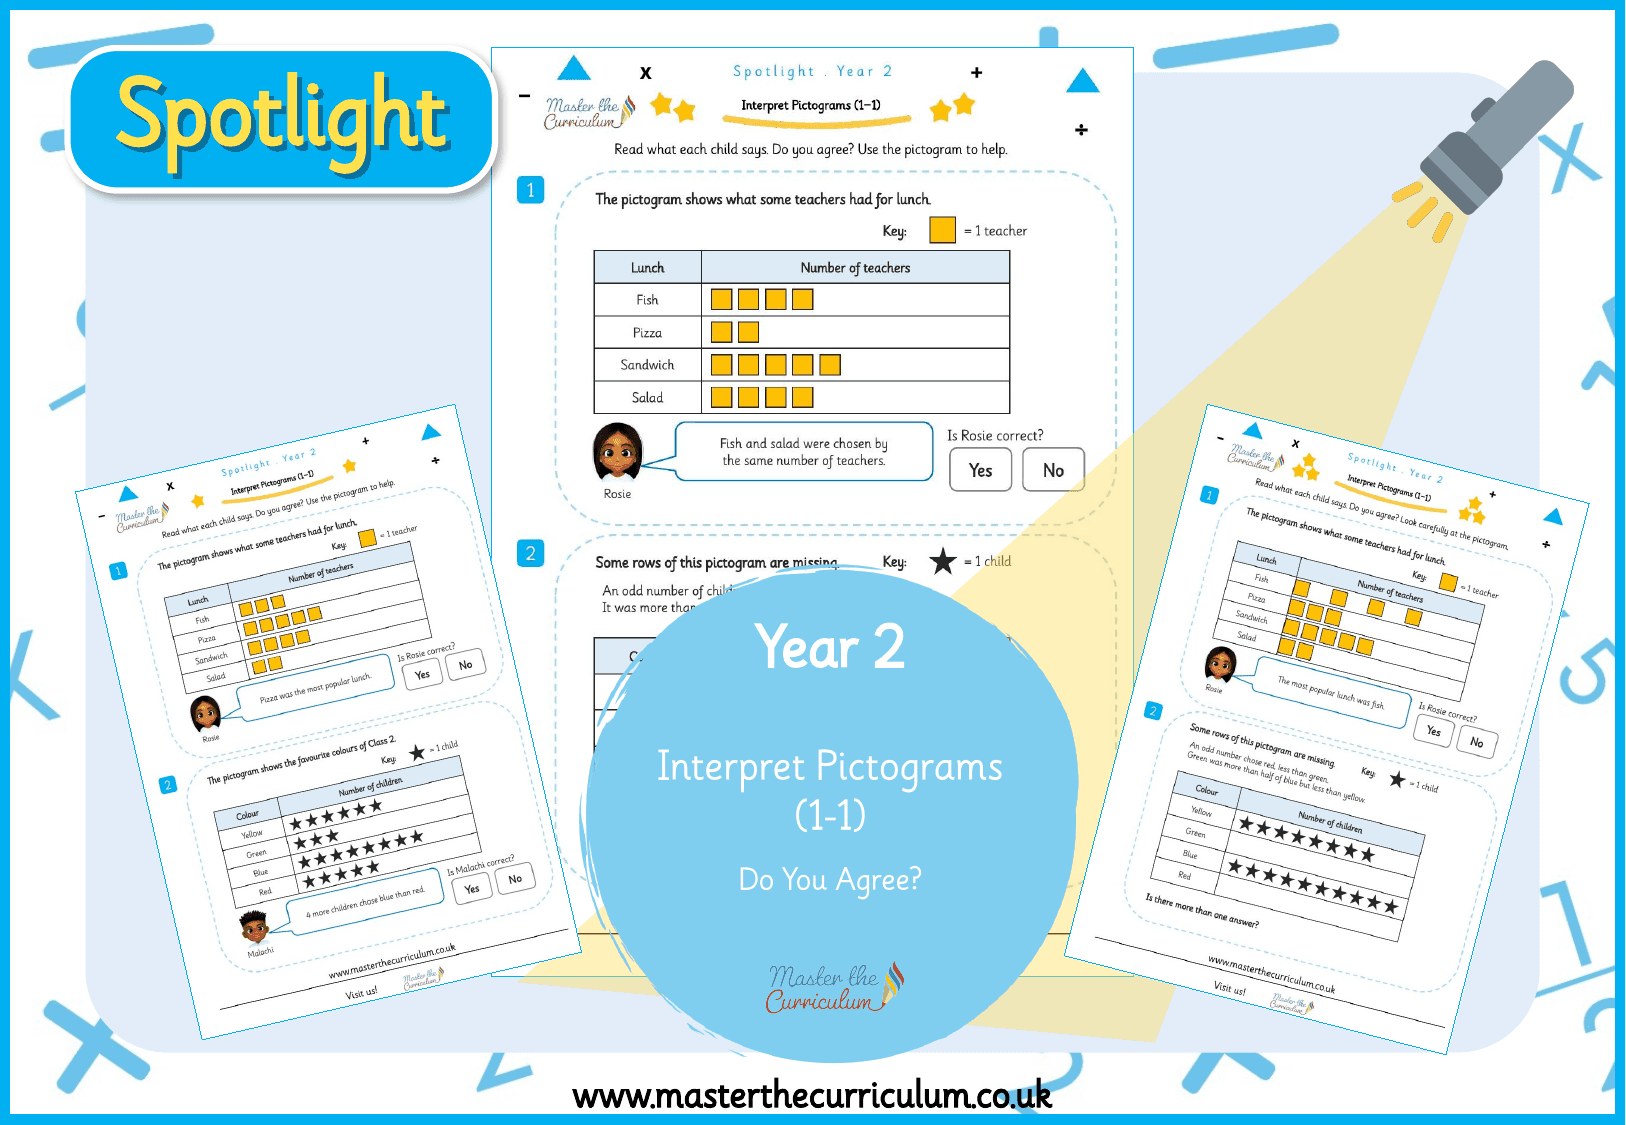
Y2
Statistics
Spotlight Y2 Interpret Pictograms: Do You Agree?
masterthecurriculum.co.uk
3 levelsIncluded with membership
Trusted by primary teachers across the UK · New resources every week
125 resources · All year groups · Premium Resources · of 219 · page 1 of 3
Narrow it downby what kind of resource it is
Same strand, other year groupsfor support and stretch
Statistics
masterthecurriculum.co.uk
3 levels
Statistics
masterthecurriculum.co.uk
3 levels
Statistics
masterthecurriculum.co.uk
3 levels
Statistics
masterthecurriculum.co.uk
3 levels
Statistics
masterthecurriculum.co.uk
3 levels
Geometry
masterthecurriculum.co.uk
3 levels
Statistics
masterthecurriculum.co.uk
3 levels
Statistics
masterthecurriculum.co.uk
3 levels
Statistics
masterthecurriculum.co.uk
3 levels
Statistics
masterthecurriculum.co.uk
3 levels
Statistics
masterthecurriculum.co.uk
3 levels
Statistics
masterthecurriculum.co.uk
3 levels
Statistics
masterthecurriculum.co.uk
3 levels
Statistics
masterthecurriculum.co.uk
3 levels
Statistics
masterthecurriculum.co.uk
3 levels
Statistics
masterthecurriculum.co.uk
3 levels
Statistics
masterthecurriculum.co.uk
3 levels
Statistics
masterthecurriculum.co.uk
3 levels
Statistics
masterthecurriculum.co.uk
3 levels
Statistics
masterthecurriculum.co.uk
3 levels
Statistics
masterthecurriculum.co.uk
3 levels
Statistics
masterthecurriculum.co.uk
3 levels
Statistics
masterthecurriculum.co.uk
3 levels
Statistics
masterthecurriculum.co.uk
3 levels
Statistics
masterthecurriculum.co.uk
3 levels
Statistics
masterthecurriculum.co.uk
3 levels
Statistics
masterthecurriculum.co.uk
3 levels
Statistics
masterthecurriculum.co.uk
3 levels
Statistics
masterthecurriculum.co.uk
3 levels
Statistics
masterthecurriculum.co.uk
3 levels
Statistics
masterthecurriculum.co.uk
3 levels
Statistics
masterthecurriculum.co.uk
3 levels
Statistics
masterthecurriculum.co.uk
3 levels
Statistics
masterthecurriculum.co.uk
3 levels
Statistics
masterthecurriculum.co.uk
3 levels
Statistics
masterthecurriculum.co.uk
3 levels
Statistics
masterthecurriculum.co.uk
3 levels
Statistics
masterthecurriculum.co.uk
3 levels
Statistics
masterthecurriculum.co.uk
3 levels
Statistics
masterthecurriculum.co.uk
3 levels
Statistics
masterthecurriculum.co.uk
3 levels
Statistics
masterthecurriculum.co.uk
3 levels
Statistics
masterthecurriculum.co.uk
3 levels
Statistics
masterthecurriculum.co.uk
3 levels
Geometry
masterthecurriculum.co.uk
3 levels
Statistics
masterthecurriculum.co.uk
3 levels
Statistics
masterthecurriculum.co.uk
3 levels
Statistics
masterthecurriculum.co.uk
3 levelsShowing 1 to 48 of 125 resources · page 1 of 3