
Y3
Statistics
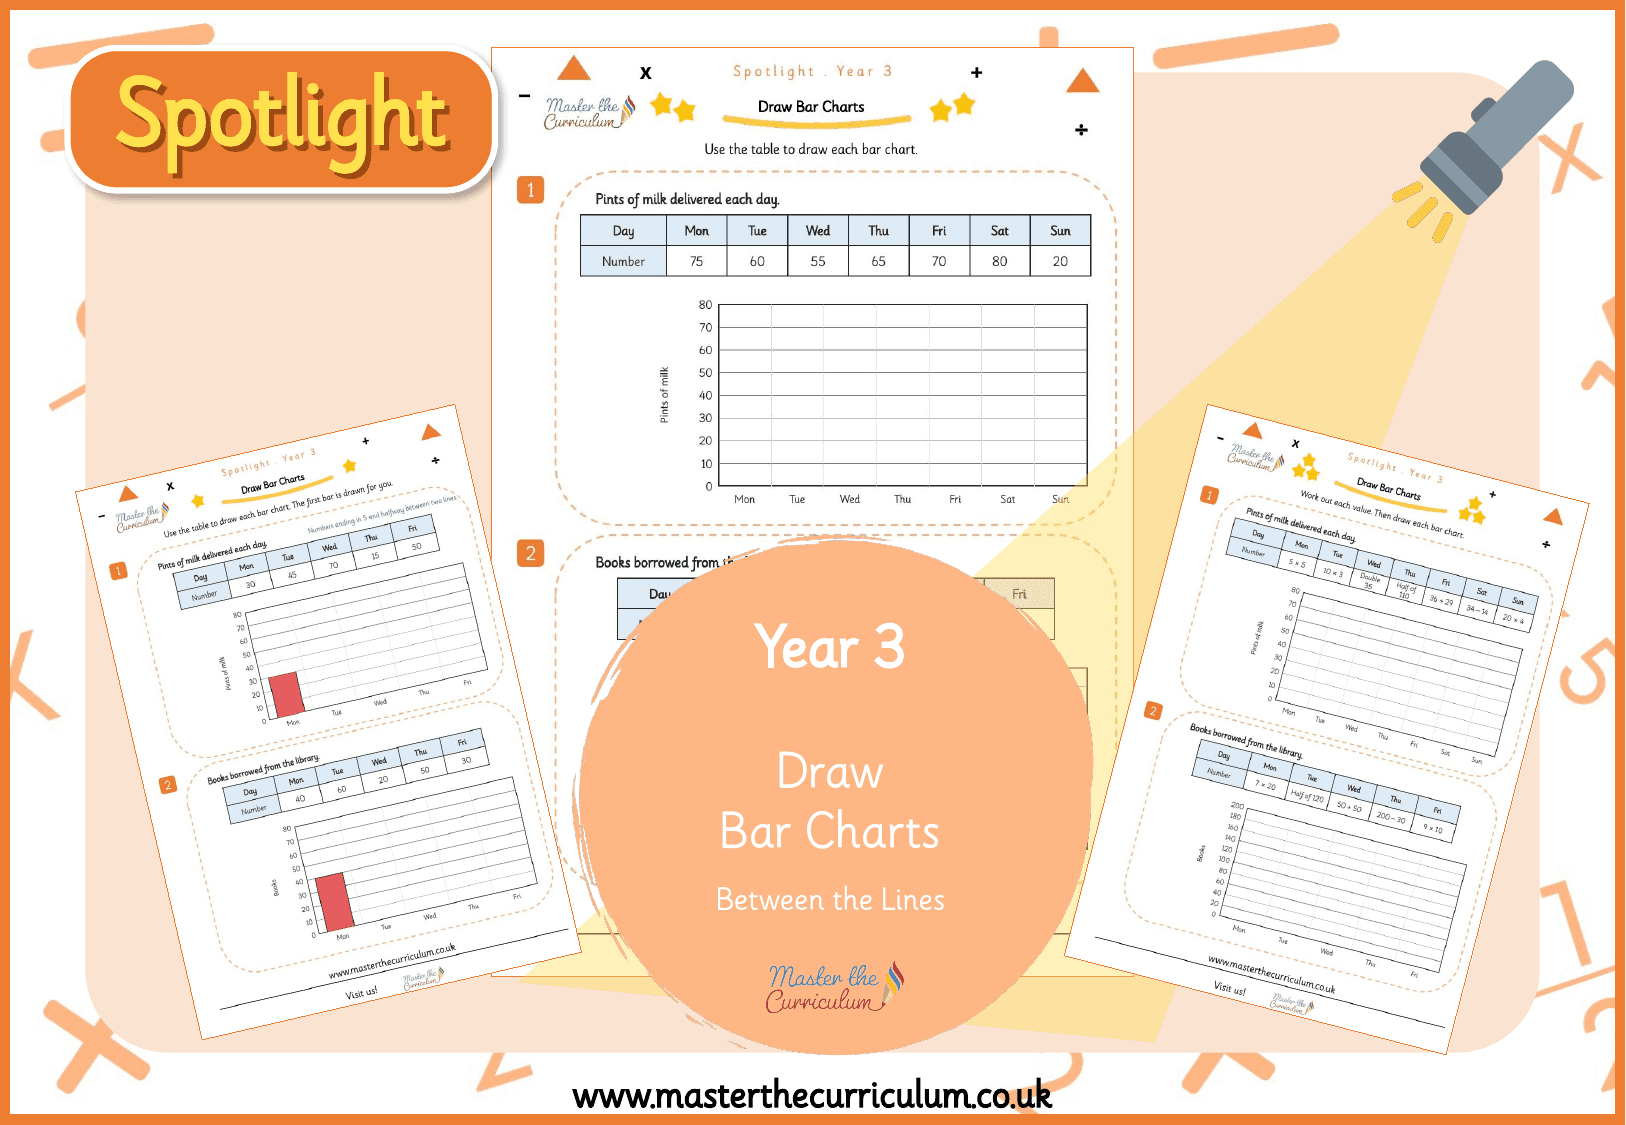
Spotlight Y3 Draw Bar Charts: Between the Lines
masterthecurriculum.co.uk
3 levelsIncluded with membership
Trusted by primary teachers across the UK · New resources every week
40 resources · Year 3
Narrow it downby what kind of resource it is
Other strands in Year 3
Back to all of Year 3 →Same strand, other year groupsfor support and stretch
Statistics
masterthecurriculum.co.uk
3 levels
Statistics
masterthecurriculum.co.uk
3 levels
Statistics
masterthecurriculum.co.uk
3 levels
Statistics
masterthecurriculum.co.uk
3 levels
Statistics
masterthecurriculum.co.uk
3 levels
Statistics
masterthecurriculum.co.uk
3 levels
Statistics
masterthecurriculum.co.uk
3 levels
Statistics
masterthecurriculum.co.uk
3 levels
Statistics
masterthecurriculum.co.uk
3 levels
Statistics
masterthecurriculum.co.uk
3 levels
Statistics
masterthecurriculum.co.uk
3 levels
Statistics
masterthecurriculum.co.uk
3 levels
Statistics
masterthecurriculum.co.uk
3 levels
Statistics
masterthecurriculum.co.uk
3 levels
Statistics
masterthecurriculum.co.uk
3 levels






Showing 1 to 40 of 40 resources