“Statistics”
233 resources · matched on the words you typed
Narrow it
More ways to narrow▾
Complete, read and interpret information in tables, including timetables – 3

Complete, read and interpret information in tables, including timetables – 4

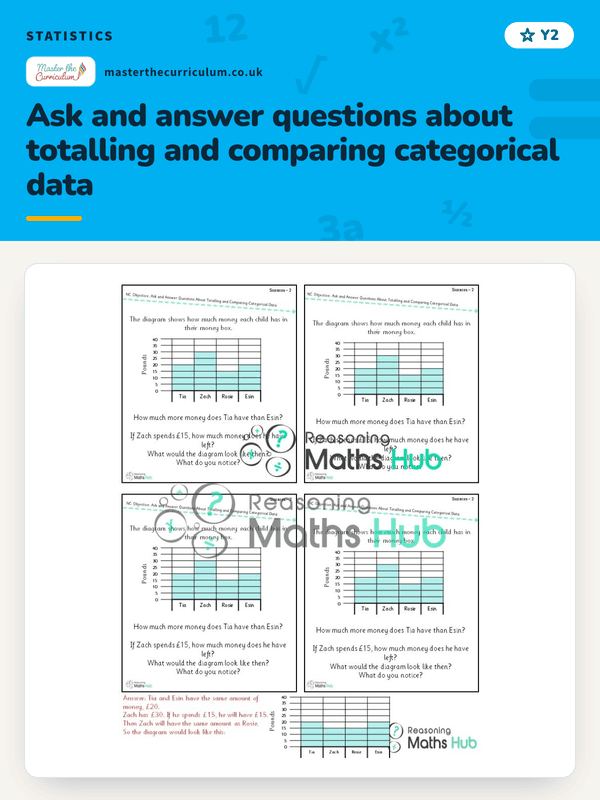
Ask and answer questions about totalling and comparing categorical data
Spotlight Y3 Draw and Represent Data: Tally and Bar Chart
masterthecurriculum.co.uk
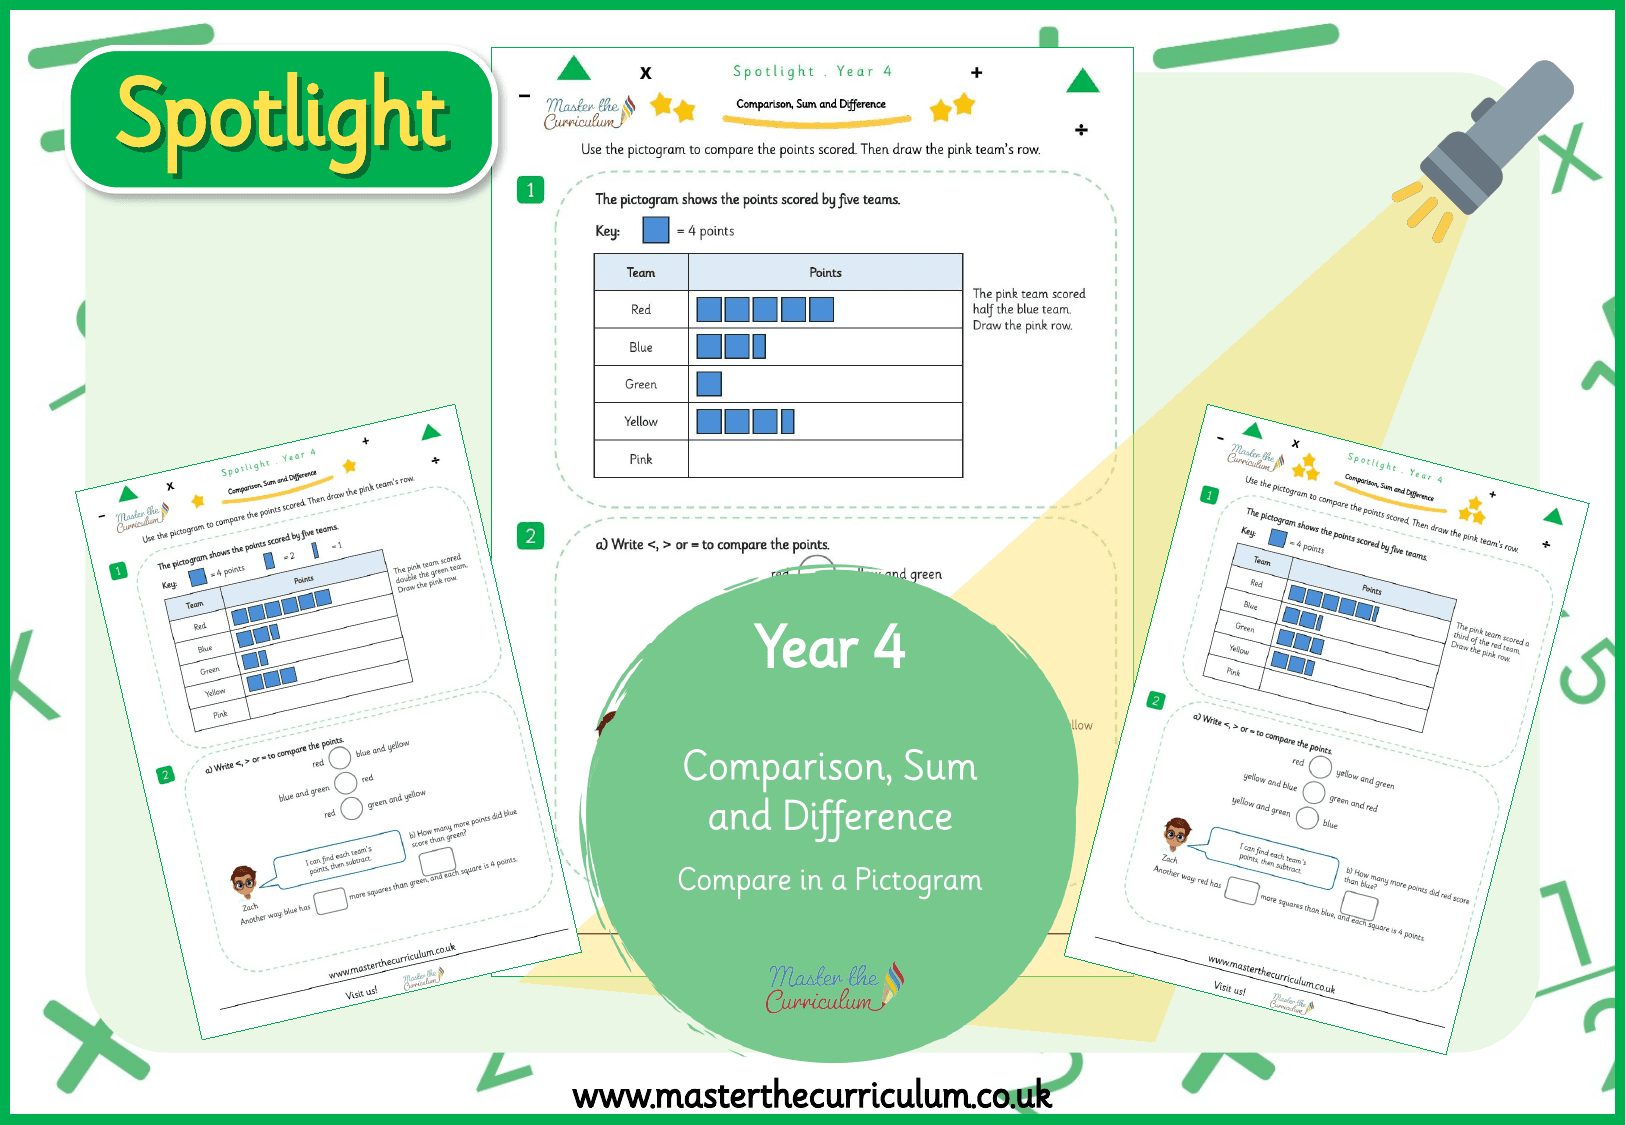
★★★3 levelsSpotlight Y4 Comparison, Sum and Difference: Compare in a Pictogram
masterthecurriculum.co.uk
★★★3 levelsSpotlight Y4 Comparison, Sum and Difference: Two Ways to Total
masterthecurriculum.co.uk
★★★3 levelsSpotlight Y6 Dual Bar Charts: Read a Dual Bar Chart
masterthecurriculum.co.uk
★★★3 levelsInterpret and present data using bar charts, pictograms and tables – 1

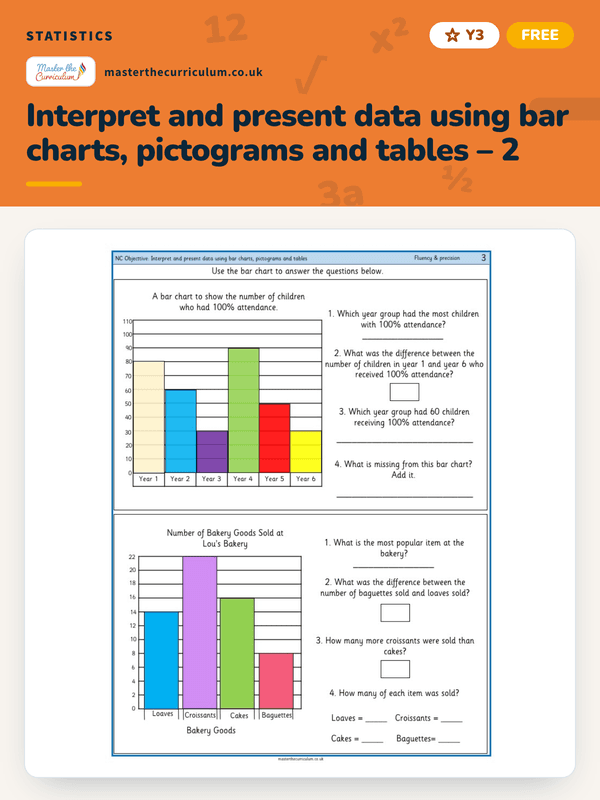
Interpret and present data using bar charts, pictograms and tables – 2
L5 Sorting and Comparing Data
Ask and answer simple questions by counting the number of objects in each category

Year 5 worksheets: distance charts – read and compare distances between cities. 3 differentiated sheets with answers.
masterthecurriculum.co.uk
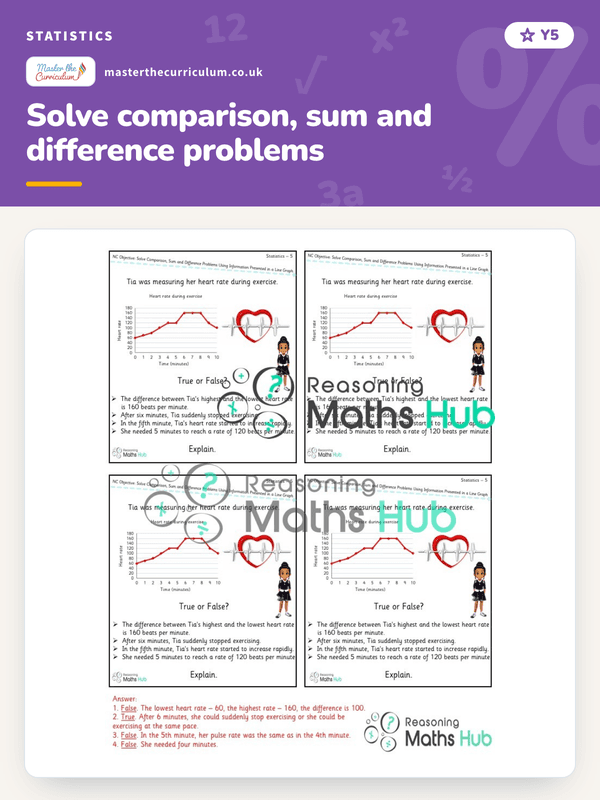
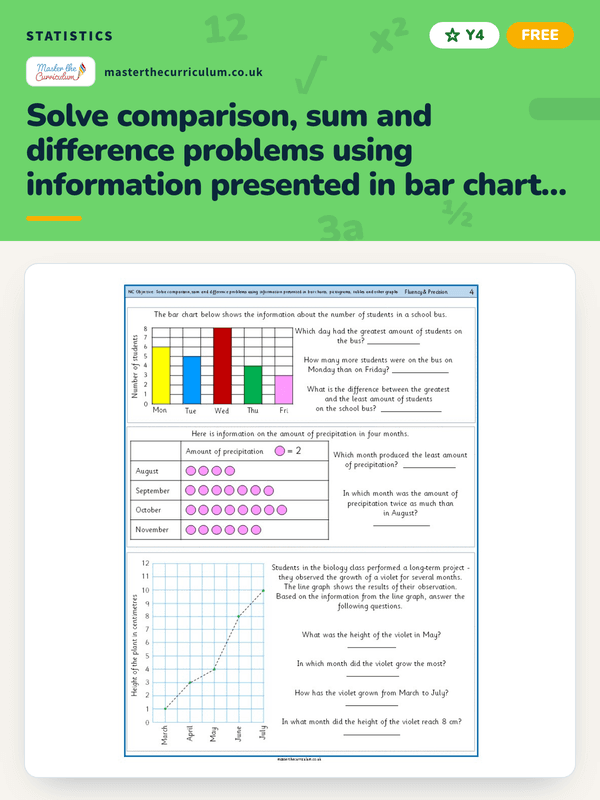
★★★3 levelsSolve comparison, sum and difference problems using information presented in bar charts, pictograms, tables and other graphs
Read scales where not all numbers on the scale are given and estimate points in between – 1

Read scales where not all numbers on the scale are given and estimate points in between – 3

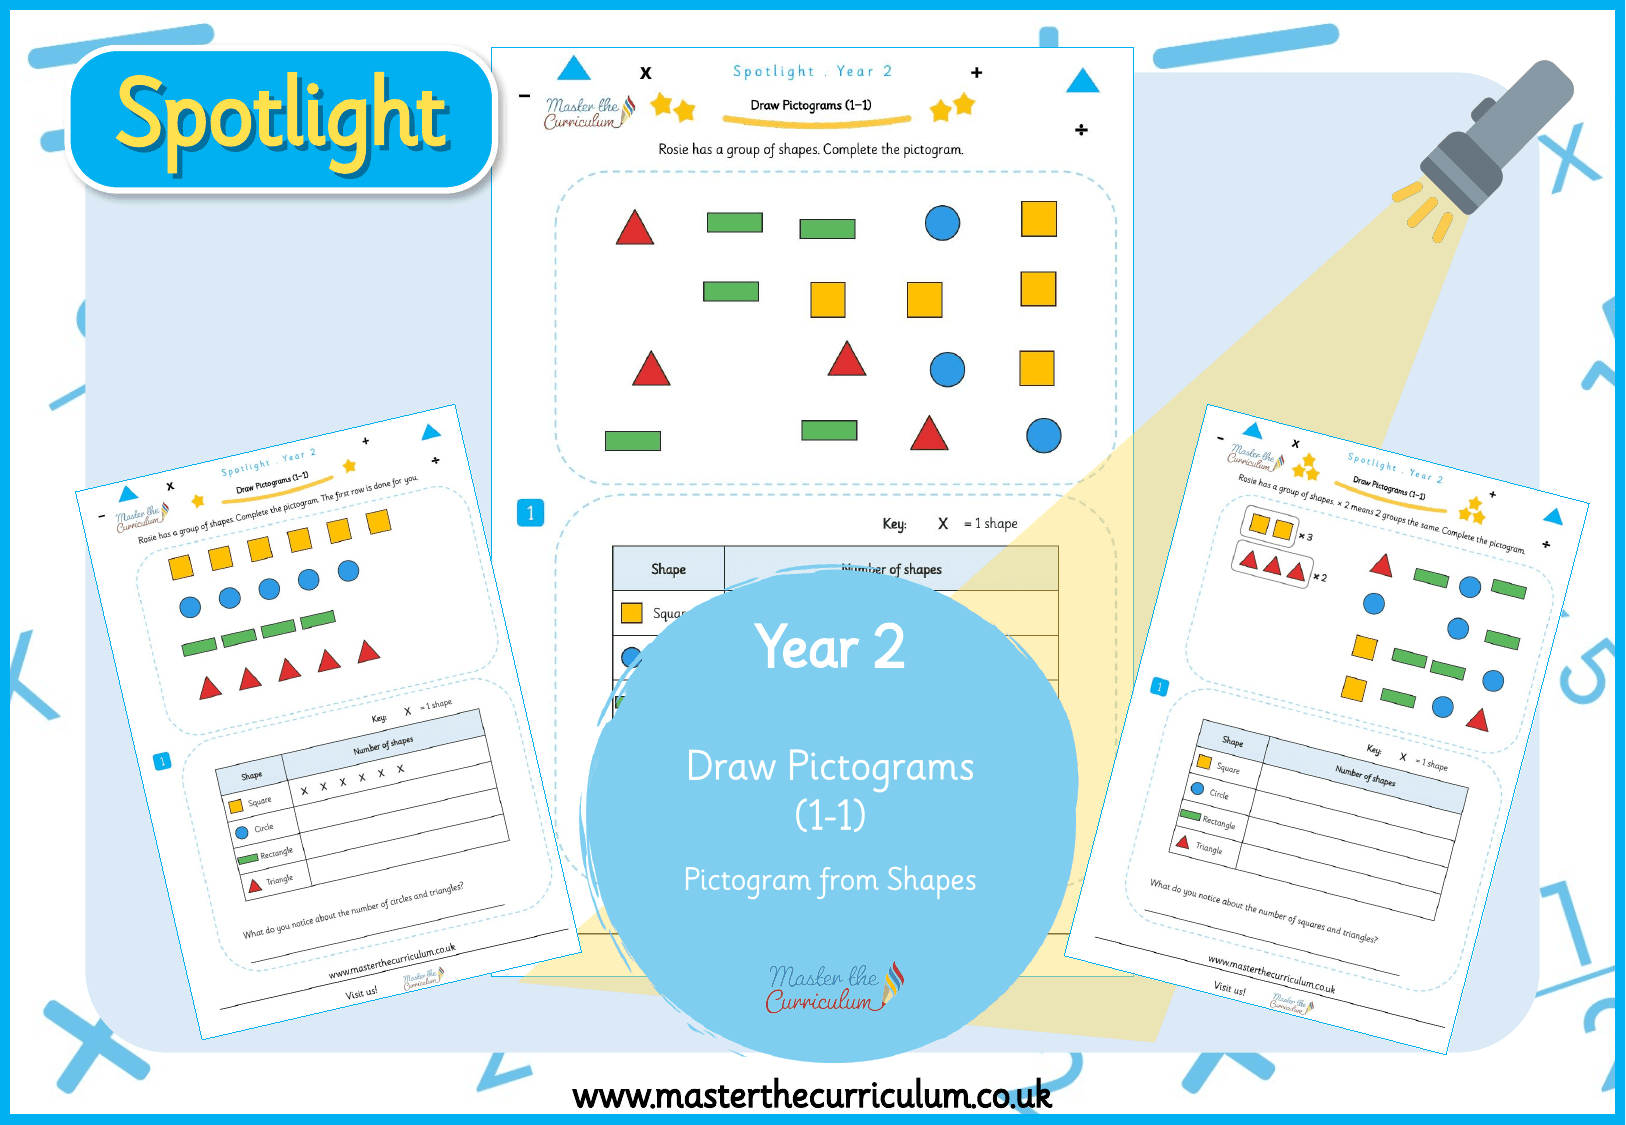
Spotlight Y2 Draw Pictograms: Pictogram from Shapes
masterthecurriculum.co.uk
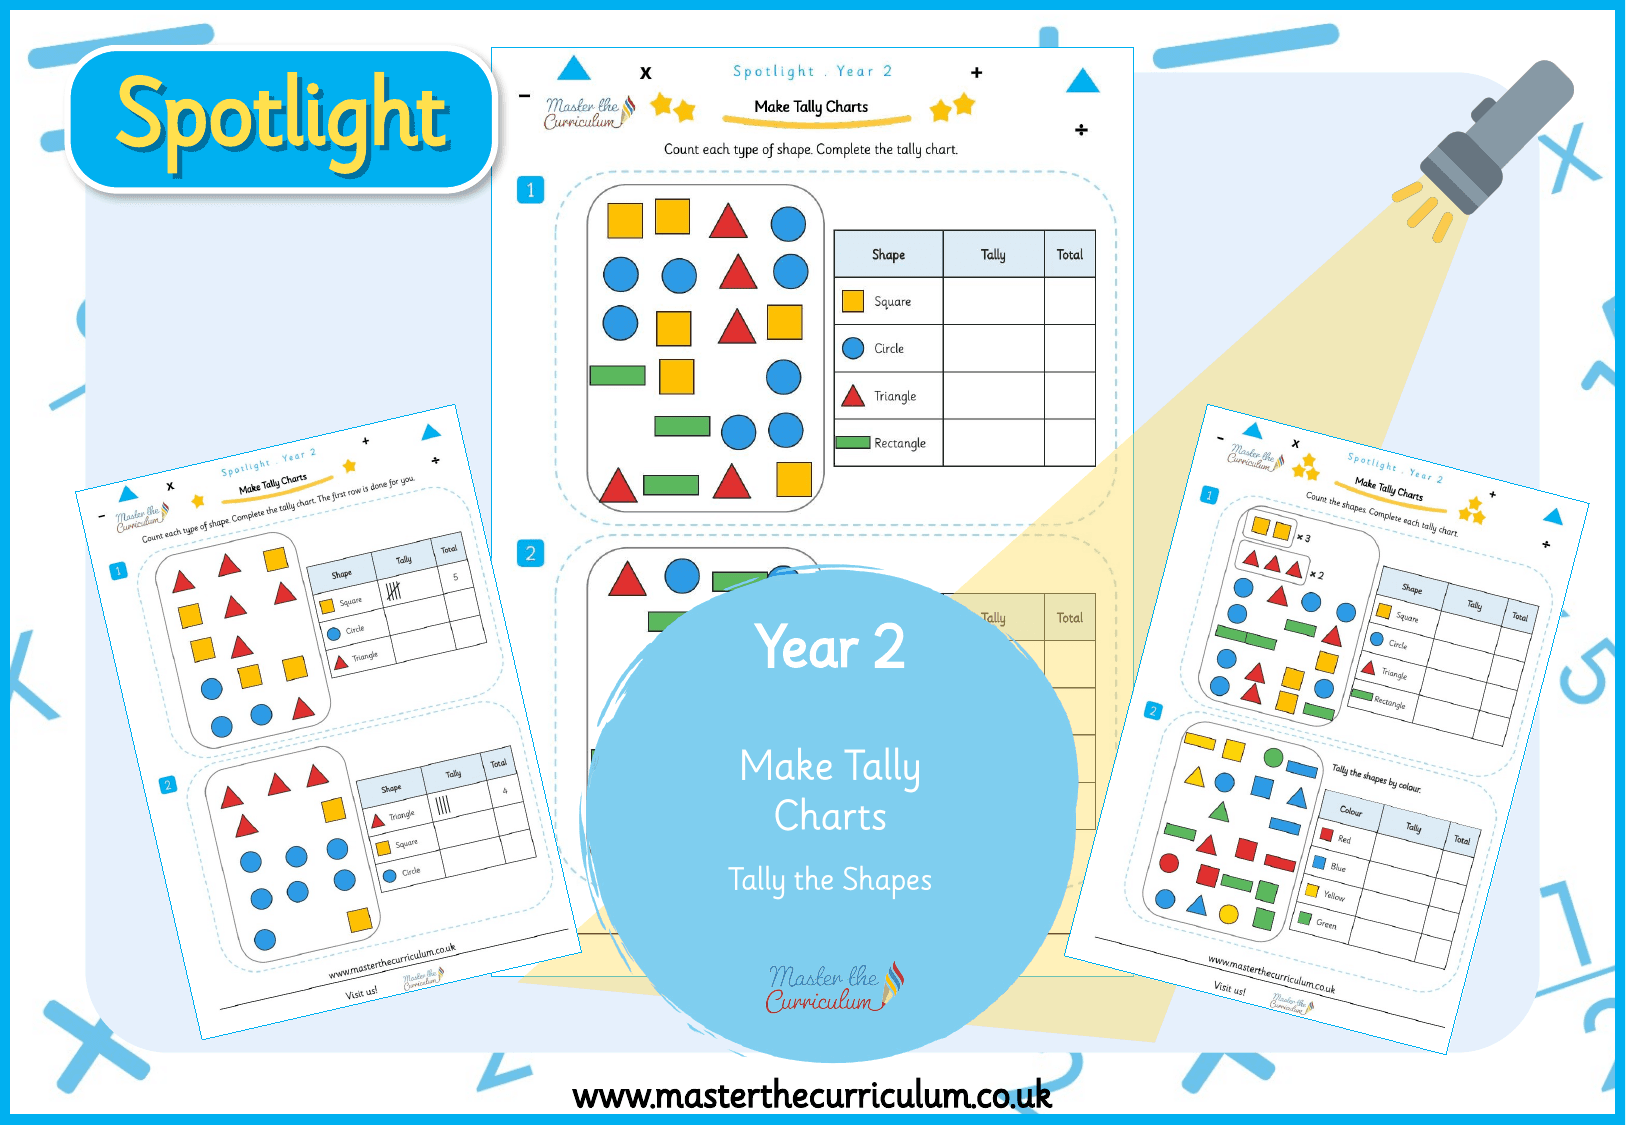
★★★3 levelsSpotlight Y2 Make Tally Charts: Tally the Shapes
masterthecurriculum.co.uk
★★★3 levelsSpotlight Y6 Pie Charts: Fractions of a Pie Chart
masterthecurriculum.co.uk
★★★3 levelsInterpret and present discrete and continuous data using appropriate graphical methods, including bar charts and time graphs – 1
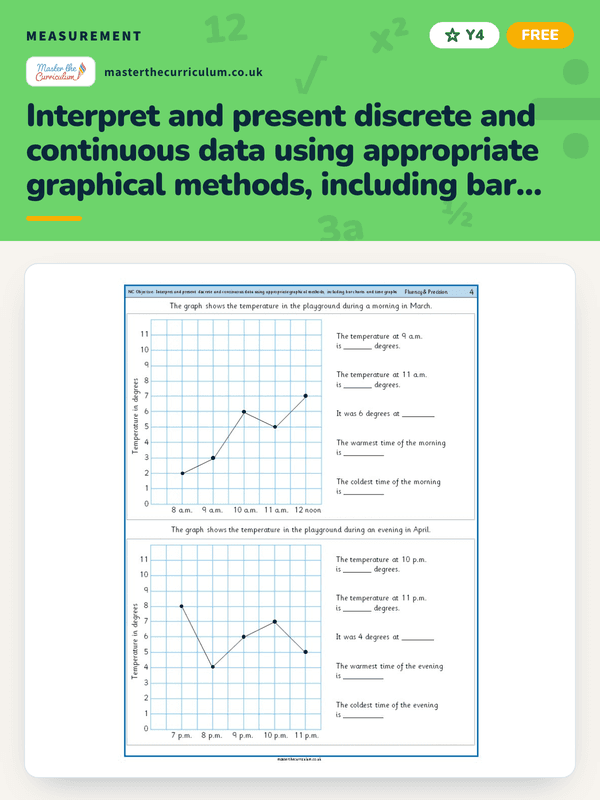
Interpret and present discrete and continuous data using appropriate graphical methods, including bar charts and time graphs – 2
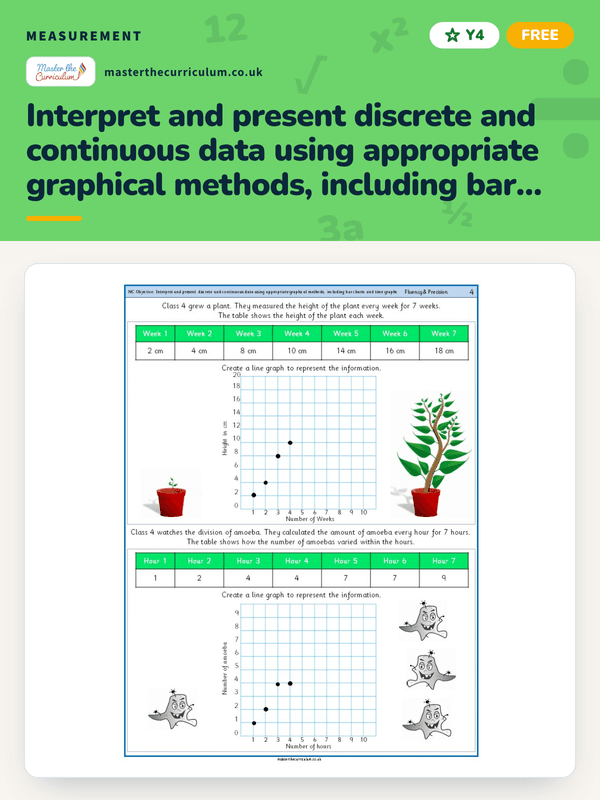
Interpret and present discrete and continuous data using appropriate graphical methods, including bar charts and time graphs – 3
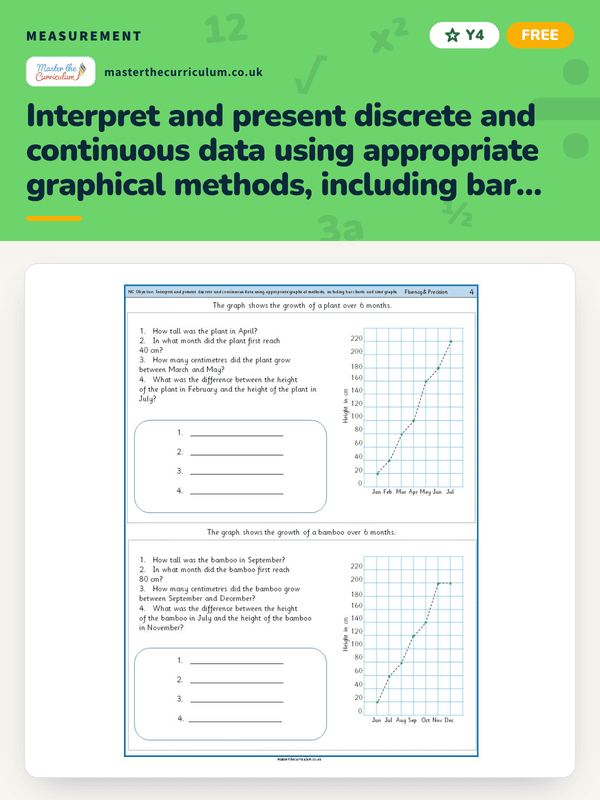
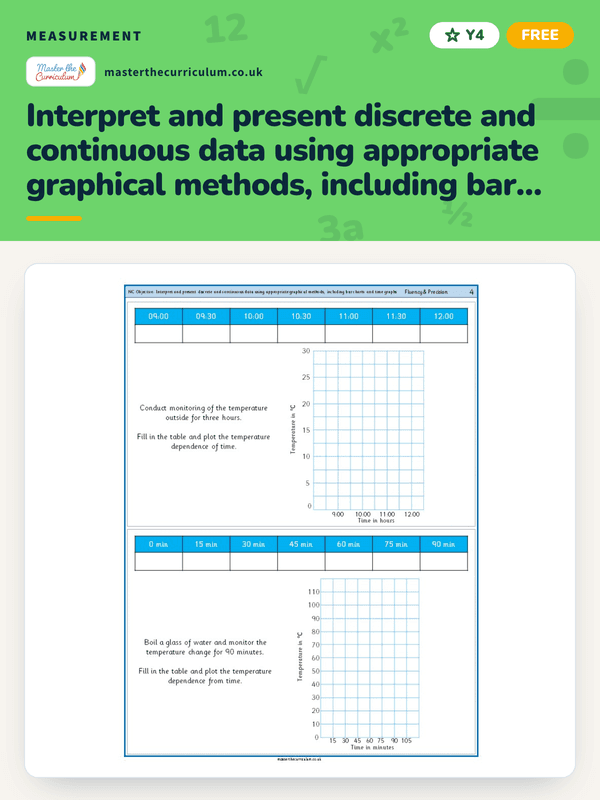
Interpret and present discrete and continuous data using appropriate graphical methods, including bar charts and time graphs – 4
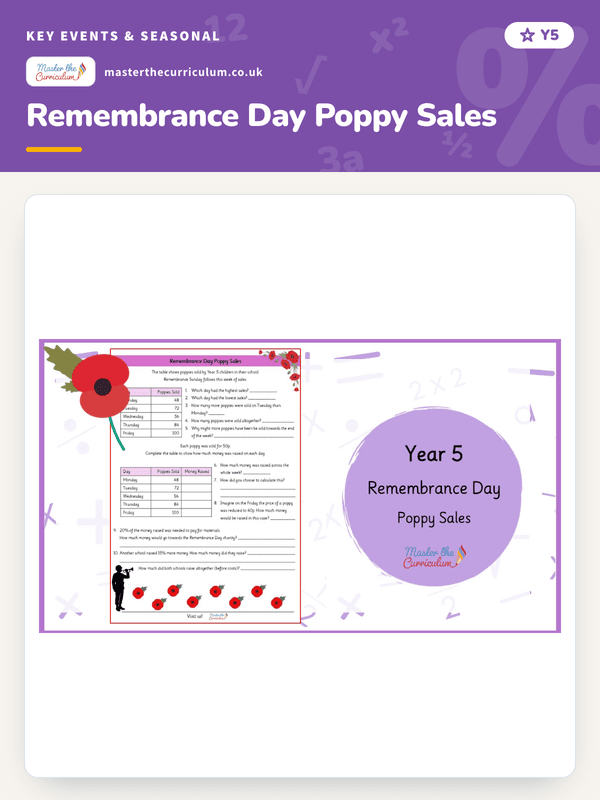
Remembrance Day Poppy Sales
Year 2 – Mini Maths Assessments

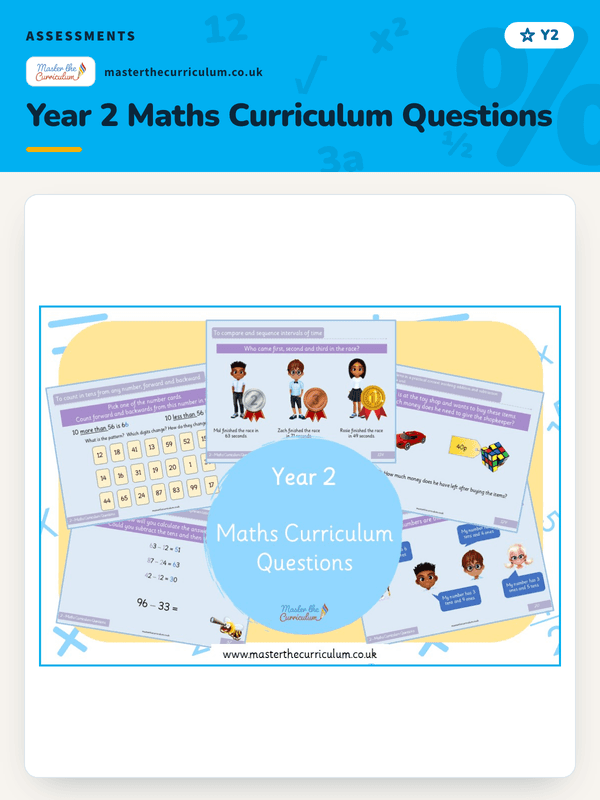
Year 2 Maths Curriculum Questions
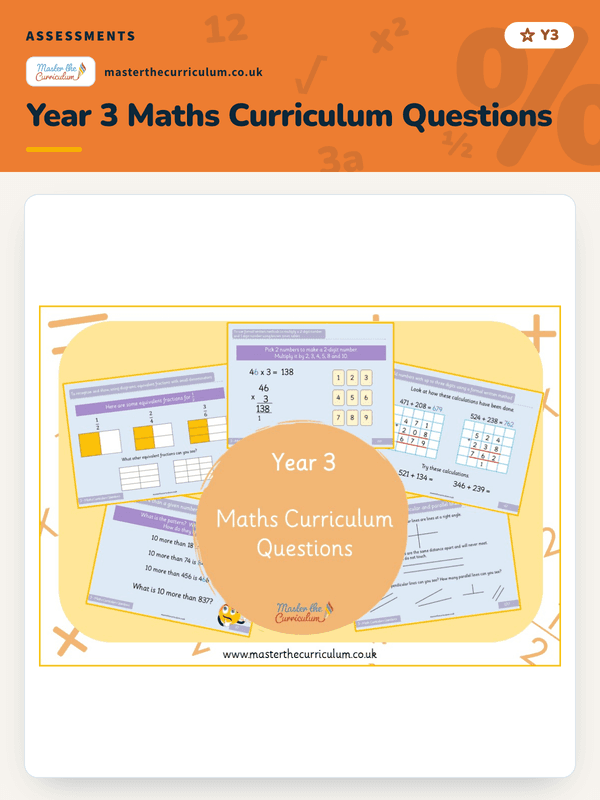
Year 3 Maths Curriculum Questions
Year 4 Maths Curriculum Questions
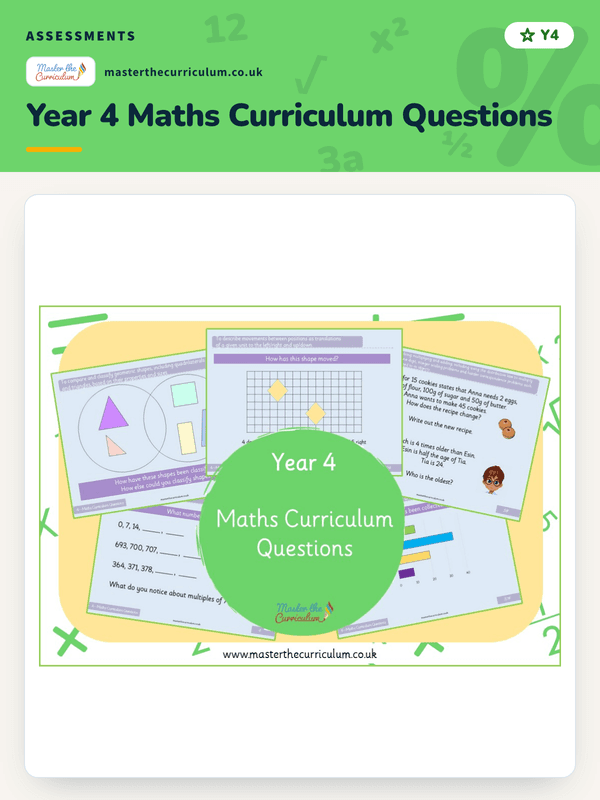
Year 5 Maths Curriculum Questions
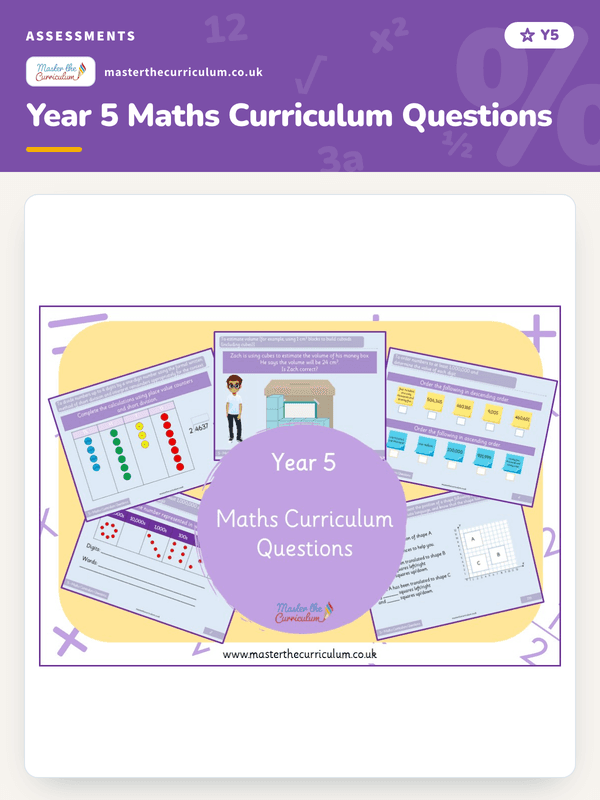
Year 6 Maths Curriculum Questions
Interpret and construct pie charts

Interpret and construct pie charts

Interpret and construct pie charts

Interpret and construct pie charts

Interpret and construct pie charts

Solve comparison, sum and difference problems
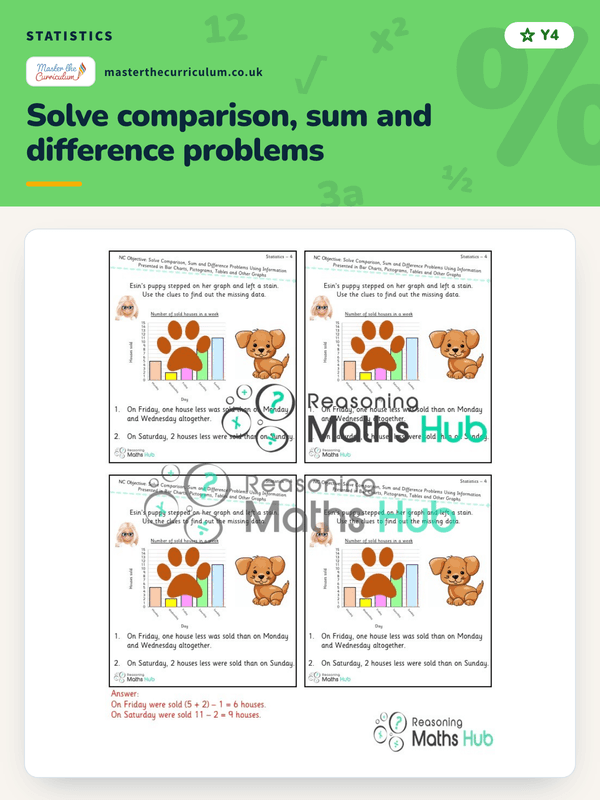
Solve comparison, sum and difference problems
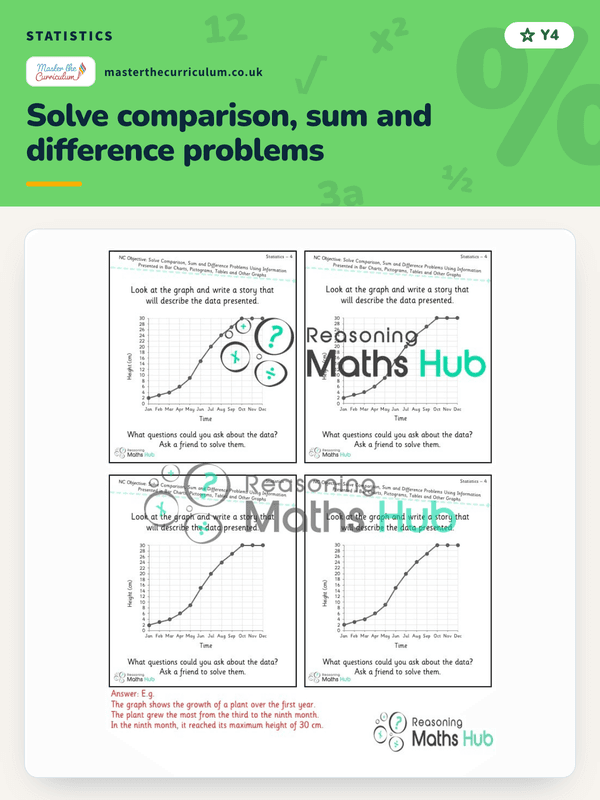
Solve comparison, sum and difference problems
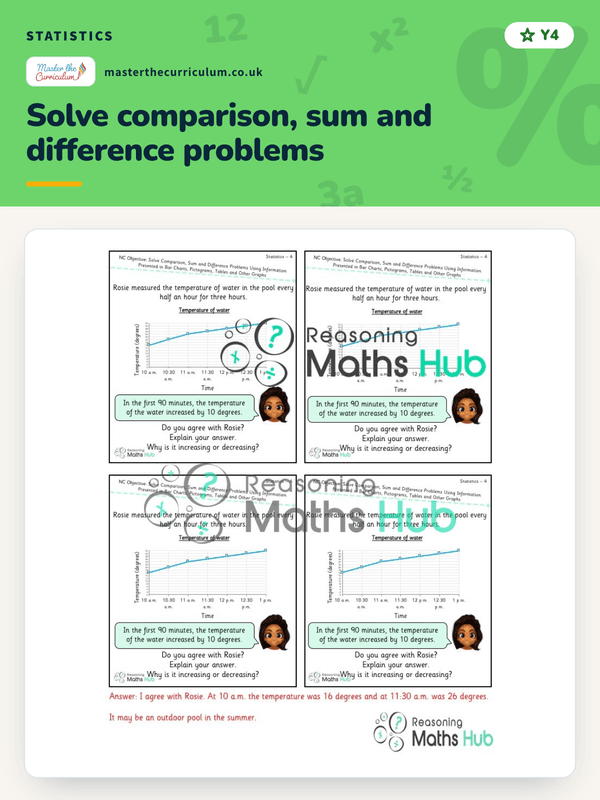
Solve comparison, sum and difference problems

Solve comparison, sum and difference problems

Solve comparison, sum and difference problems
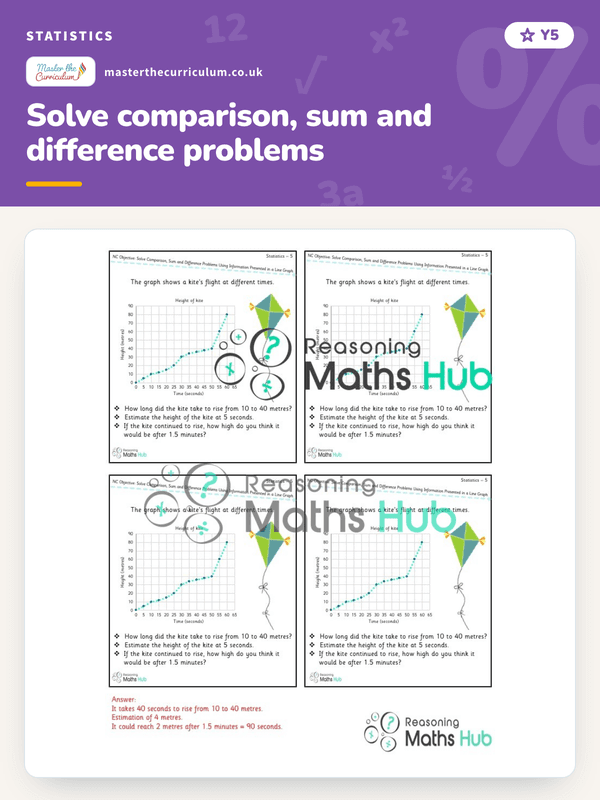
Solve comparison, sum and difference problems
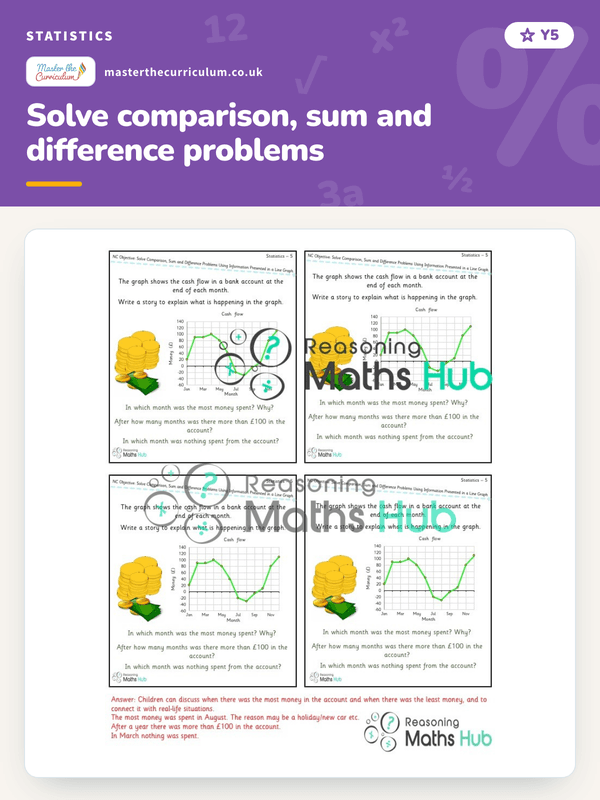
Solve comparison, sum and difference problems
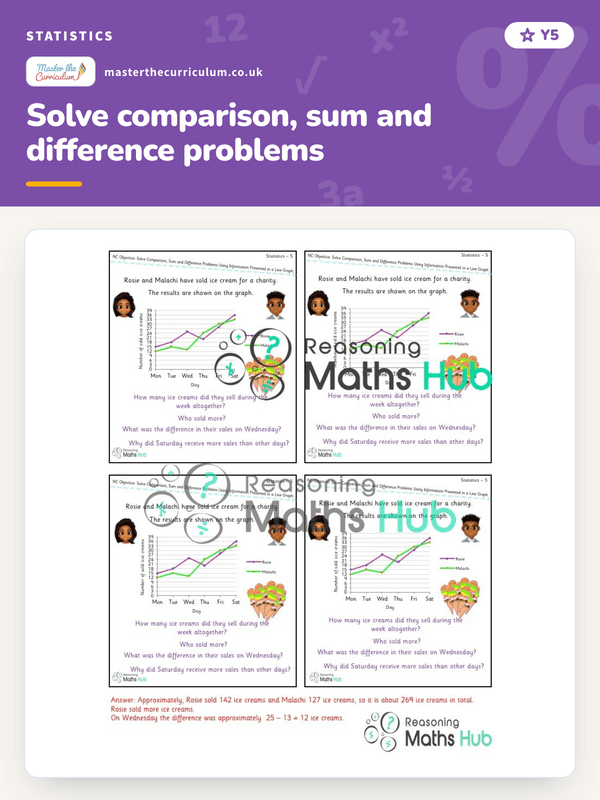
Solve comparison, sum and difference problems